接下來五篇文章介紹一些視覺化資料的工具與功能,挑選不同類型的圖來說明。今天來討論Pandas中一些基本的資料視覺化功能。
The following 5 articles will talk about some data visualization tools and different types of graphs.
# 載入所需套件 import packages
import pandas as pd
import numpy as np
import matplotlib.pyplot as plt
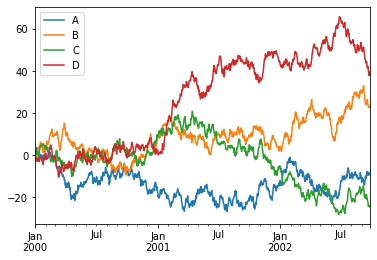
趨勢圖是一種在時間序列中表達數據變量的統計圖表。
A run-sequence plot is a graph that displays observed data in a time sequence.
# 創造一些隨機資料 create some data with random value
ts = pd.Series(np.random.randn(1000), index=pd.date_range('1/1/2000', periods=1000))
ts = ts.cumsum() # 計算累積值 cumulative sum
df = pd.DataFrame(np.random.randn(1000, 4),
                  index=ts.index, columns=list('ABCD'))
df = df.cumsum()
plt.figure(); # 定義一個圖像窗口 define an image window
df.plot(); # 繪圖 plot
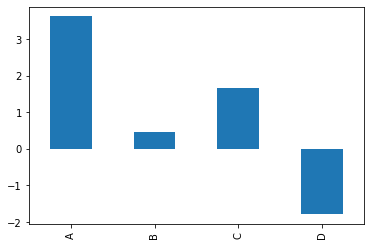
主要用於展示不同類別間的差異,多用以表達內容較為獨立且缺乏連續性的數量資料。
A bar plot is a graph that presents categorical data with rectangular bars.
plt.figure();
df.iloc[5].plot(kind='bar'); # 可以使用 kind 參數指定繪圖種類 use parameter kind to specify plot style is also doable
df2 = pd.DataFrame(np.random.rand(10, 4), columns=['a', 'b', 'c', 'd'])
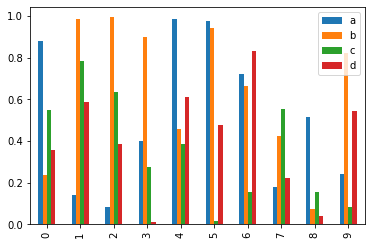
df2.plot.bar();
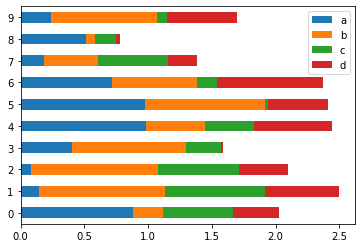
# 使用 barh 繪製水平的柱狀圖 use barh to plot horizontal bar plot
df2.plot.barh(stacked=True); # stacked 參數設定 True 會把資料疊在一起顯示 set stacked to True to stack the data together
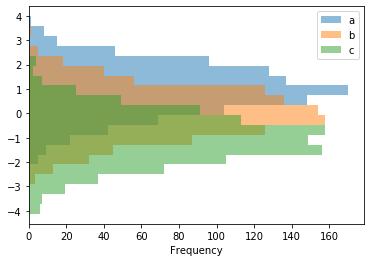
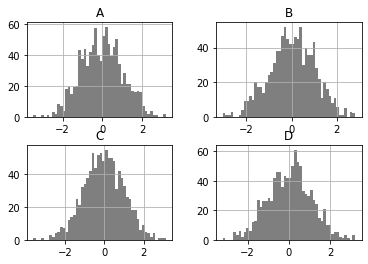
多用以表達有連續性的資料次數。
Often used to display the distribution of a continuous numerical data.
df4 = pd.DataFrame({'a': np.random.randn(1000) + 1, 'b': np.random.randn(1000),
                    'c': np.random.randn(1000) - 1}, columns=['a', 'b', 'c'])
plt.figure();
df4.plot.hist(alpha=0.5, bins=20, orientation='horizontal') # orientation 參數指定繪製方向
plt.figure()
df.diff().hist(color='k', alpha=0.5, bins=50)
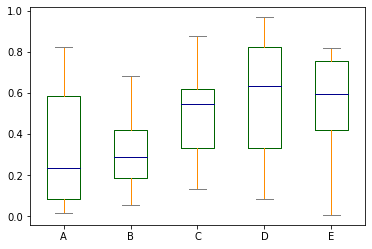
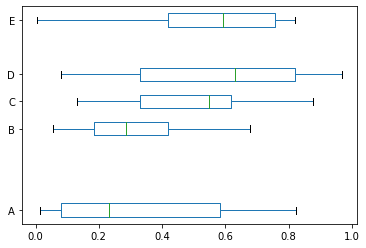
盒鬚圖可用來了解資料的偏斜性及識別出離群值;它能顯示出一組數據的最大值、最小值、中位數(盒子中的橫線)、及上下四分位數(盒子包含資料的中間百分之50的部分)。
We can tell the skewness and outlier using boxplot. It shows both the max and min value, the median (the line in the box), and the quartiles (the box contains data from the 25th to the 75th percentile) of the data.
df = pd.DataFrame(np.random.rand(10, 5), columns=['A', 'B', 'C', 'D', 'E'])
# 指定各部分繪圖顏色 specify the color of each parts
color = {'boxes': 'DarkGreen', 'whiskers': 'DarkOrange',
         'medians': 'DarkBlue', 'caps': 'Gray'}
df.plot.box(color=color, sym='r+') # sym 參數表示異常值的標記方式 sym specify the style of plotting the outlier
df.plot.box(vert=False, positions=[1, 4, 5, 6, 8]) # vert 設定是否垂直 set vert to False to plot horizontally
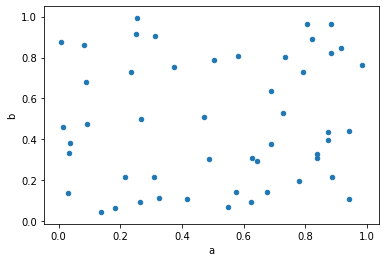
散佈圖用來概略地估計兩個計量變數間有無相關關係,亦能顯示數據集群的形狀。
A scatter plot is a type of plot using Cartesian coordinates to display values for typically two variables for a set of data.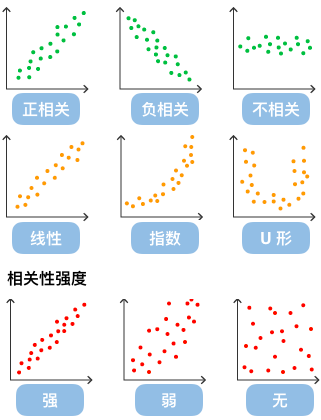
df = pd.DataFrame(np.random.rand(50, 4), columns=['a', 'b', 'c', 'd'])
df.plot.scatter(x='a', y='b');
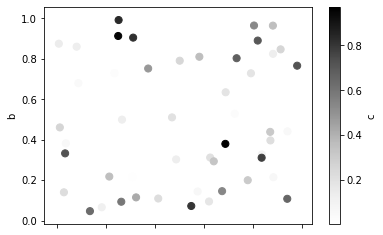
df.plot.scatter(x='a', y='b', c='c', s=50);
本篇程式碼請參考Github。The code is available on Github.
文中若有錯誤還望不吝指正,感激不盡。
Please let me know if there’s any mistake in this article. Thanks for reading.
Reference 參考資料:
[1] 第二屆機器學習百日馬拉松內容
[2] Visualization
[3] 給工程師的統計學及資料分析
[4] Graphical Techniques: By Problem Category
[5] 散点图
[6] Run chart
[7] Bar chart
[8] Scatter plot
