# 載入所需套件 import the packages we need
import pandas as pd
import numpy as np
import matplotlib.pyplot as plt
import seaborn as sns
import plotly as py

import warnings # 忽略警告訊息
warnings.filterwarnings("ignore")
# 讀入昨天存的檔案來分析 read in the file we created yesterday
df = pd.read_csv('df.csv')
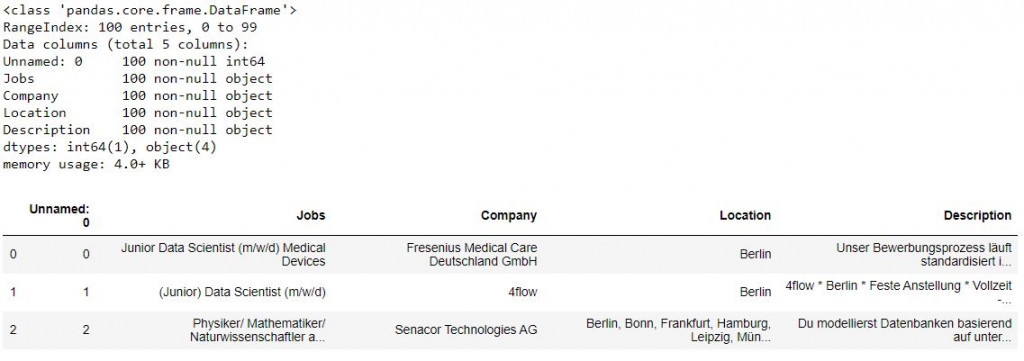
df.info() # 查看資料細節 the info of data
df.head(3) # 叫出前三筆資料看看 print out the top three rows of data

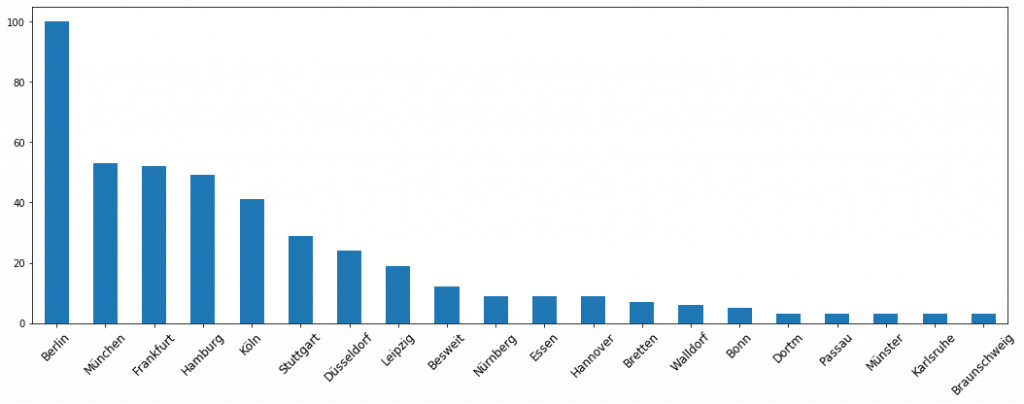
# 把地點分布畫出來,看看這些職缺除了在柏林以外其他地點也有職缺的情形
# plot out to see how the locations look like
df['Location'] = df.Location.str.replace('Munich', 'München').str.replace(' a. M.', ' ').str.replace('a. M.', ' ').str.replace(' am Main', ' ').str.replace(' a.M.', ' ').str.replace('/M.', ' ').str.replace(' in ', '').str.replace(' in', '').str.replace('Alle', ' ').str.replace(' bei', '').str.replace('oder', '').str.replace('und', '').str.replace('/', ' ').str.replace(',', ' ').str.replace('   ', ' ').str.replace(' /M.', '.a.M.').str.replace('oder', '').str.replace('und', '').str.replace('/', ' ').str.replace(',', ' ').str.replace('  ', ' ').str.replace(' ', ',')
df.Location.head(3)
all_item_ls = np.concatenate(df.Location.map(lambda am:am.split(',')))
items = pd.Series(all_item_ls).value_counts().head(20)
plt.figure(figsize=(18 , 6))
items.plot(kind='bar')
plt.xticks(rotation=45, fontsize=12)

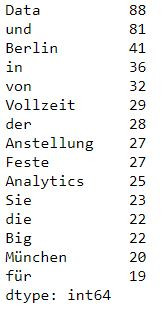
# 看看這些職缺簡介都寫了些什麼字
# see the word counts of the job posting descriptions
df['Description'] = df.Description.str.replace('(', '').str.replace(')', '').str.replace(',', '').str.replace('.', '').str.replace('*', '').str.replace('-', ' ').str.replace('&', '').str.replace('   ', ' ').str.replace('  ', ' ').str.replace(' ', ',')
df.Description.head(3)
all_words = np.concatenate(df.Description.map(lambda am:am.split(',')))
words = pd.Series(all_words).value_counts()
words.head(15)

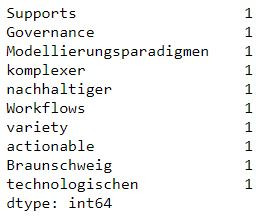
words.tail(10)

# 看看職缺標題都寫了些什麼字
# see the word counts of the job postings
df['Jobs'] = df.Jobs.str.replace('(', '').str.replace(')', '').str.replace(',', ' ').str.replace('.', '').str.replace('/', '').str.replace('*', '').str.replace('-', ' ').str.replace('–', ' ').str.replace('&', '').str.replace('   ', ' ').str.replace('  ', ' ').str.replace(' ', ',')
df.Jobs.head(3)
all_jobs = np.concatenate(df.Jobs.map(lambda am:am.split(',')))
jobs = pd.Series(all_jobs).value_counts()
jobs.head(30)

本篇程式碼請參考Github。The code is available on Github.
文中若有錯誤還望不吝指正,感激不盡。
Please let me know if there’s any mistake in this article. Thanks for reading.
Reference 參考資料:
[1] Tutorial: Python Web Scraping Using BeautifulSoup
[2] Stepstone
