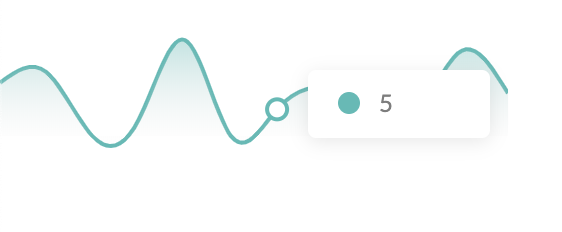
昨天我們完成了折線圖,今天我們將會為折線圖加上一點進場動畫及互動的資料提示。
通常折線圖的進場動畫就是由左而右畫出線,那麼該怎麼實作呢?我的想法是做一個白色的方形遮住整個圖表,這個方形再隨著時間往右移開,這樣看起來就是圖表由左而右的長出來。
svg
    .append('rect')
    .attr('class', 'mask')
    .attr('width', chartWidth)
    .attr('height', chartHeight + margin.top + margin.bottom)
    .attr('fill', '#ffffff')
    .attr('x', 0) //一開始的x為0
    .transition()
    .duration(1000) //時間設定為一秒
    .attr('x', chartWidth); //最後的x為圖表的最右邊

與長條圖一樣,因為沒有明顯的座標可以看出每一點的數據為何,所以一樣做出hover上去tooltip出現的效果,有了之前那次的經驗大家應該都知道該怎麼做了吧~
值得注意的一點是,我們的curve是選擇curveBasic這個形式,這會讓線沒有通過我們實際的x y,原本是為了讓線不要超出svg,但這邊我們必須要標出實際的x y點,所以我們改成curveNatural,也記得要調整一下margin讓整個圖表能夠顯示出來。有關curve的形式比較可以看看這個範例:
https://bl.ocks.org/d3noob/ced1b9b18bd8192d2c898884033b5529
// 定義一下圓形的標示點並預設隱藏起來
const dot = g
    .append('circle')
    .attr('class', 'dot')
    .attr('r', 5)
    .attr('stroke', '#00BAB6 ')
    .attr('stroke-width', 2)
    .attr('fill', '#ffffff')
    .attr('opacity', '0');

// 定義訊息框的樣式,同樣使用div
const messageWrapper = d3
    .select(`#line-chart-${this.id}`)
    .append('div')
    .attr('class','line-message-wrapper')
    .attr('id', `line-message-wrapper-${this.id}`)
    .html('<div class="circle"></div><div class="data"></div>')
    .attr('style', 'display: none;');

// hover觸發範圍
g.selectAll(`.line-hover-block-${this.id}`)
    .data(data)
    .enter()
    .append('rect')
    .attr('class', `line-hover-block-${this.id}`)
    .attr('width', chartWidth / data.length)
    .attr('height', chartHeight)
    .attr('fill', 'transparent')
    .attr('x', (d, i) => x(i) - (chartWidth / data.length / 2))
    .on('mouseover', (d, i) => {
      dot
        .attr('cx', () => x(i)) //圓形標示點的x
        .attr('cy', () => y(d.value)) //圓形標示點的y
        .attr('opacity', 1);

      d3.select(`#line-message-wrapper-${this.id} .data`).html(`${d.value}`); //加入數據

      messageWrapper.attr('style', () => `display: flex; left: ${x(i) + 15}px; top: ${y(d.value)}px`); // 訊息框的位置
    })
    .on('mouseleave', () => {
      dot.attr('opacity', 0);
      messageWrapper.attr('style', 'display: none;');
    });
線圖基本上就大功告成啦~~

今天的commit: https://github.com/yuanchen1103/2020ironman-weather/commit/be1eb85801ebf0b46312bf8d4b6ce8495413edb1
經過這幾天,相信大家對d3畫基本圖表都已經有了感覺了,其實網路上範例很多,就算碰到沒看過的樣式也可以找到類似的圖或邏輯,照著修改就行了。
那麼d3畫圖到這邊就告一個段落,明天我們將會進入接api資料的部分,因為這系列的文章重點在d3實作,網頁排版就不會一個一個細講,所以在那之前可能要麻煩大家刻一下整個畫面的layout成設計圖的樣子:
設計圖:https://yuanchen1103.github.io/2020ironman-weather-design/
這邊可以提示一下,三個線圖都會使用我們剛剛做好的component,所以顏色、icon等可以當作props傳進去,那我們明天見!
