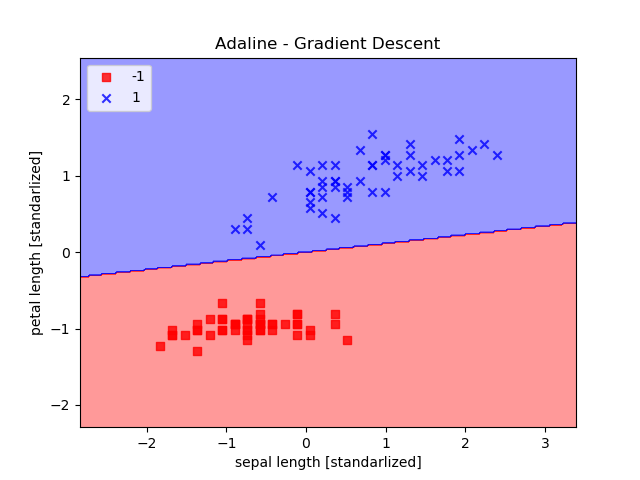
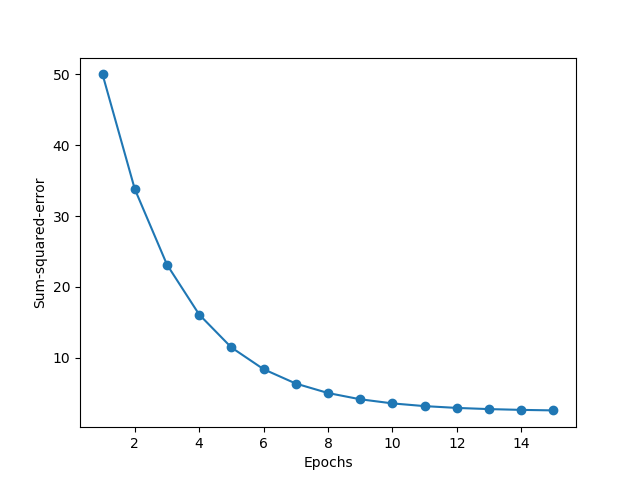
由於由於在ML_Day4(Perceptron感知器模型)有講過Perceptron,做法其實很類似,指示修改fit方法。
import numpy as np
import pandas as pd
import matplotlib.pyplot as plt
from matplotlib.colors import ListedColormap


class AdalineGD:
    def __init__(self, eta=0.01, n_iter=50):
        self.eta = eta
        self.n_iter = n_iter

    def fit(self, X, y):
        self.w_ = np.zeros(1 + X.shape[1])
        self.cost_ = []


        for i in range(self.n_iter):
            output = self.net_input(X)
            errors = (y - output)
            self.w_[1:] += self.eta * X.T.dot(errors)
            self.w_[0] += self.eta * errors.sum()
            cost = (errors**2).sum()/2.0
            self.cost_.append(cost)

        return self

    def net_input(self, X):
        return np.dot(X, self.w_[1:]) + self.w_[0]

    def activation(self, X):
        return self.net_input(X)

    def predict(self, X):
        return np.where(self.activation(X) >= 0.0, 1, -1)


def plot_decision_regions(X, y, classifier, resolution=0.02):
    # setup marker generator and color map
    markers = ('s', 'x', 'o', '^', 'v')
    colors = ('red', 'blue', 'lightgreen', 'gray', 'cyan')
    cmap = ListedColormap(colors[:len(np.unique(y))])

    x1_min, x1_max = X[:, 0].min() - 1, X[:, 0].max() + 1
    x2_min, x2_max = X[:, 1].min() - 1, X[:, 1].max() + 1
    xx1, xx2 = np.meshgrid(np.arange(x1_min, x1_max, resolution), np.arange(x2_min, x2_max,
    resolution))
    # print(xx1.shape)
    # print(np.array([xx1.ravel(), xx2.ravel()]).T.shape)
    z = classifier.predict(np.array([xx1.ravel(), xx2.ravel()]).T)
    # print(z.shape)
    z = z.reshape(xx1.shape)
    # print(z.shape)
    plt.contourf(xx1, xx2, z, alpha=0.4, cmap=cmap)
    plt.xlim(xx1.min(), xx1.max())
    plt.ylim(xx2.min(), xx2.max())

    for idx, cl in enumerate(np.unique(y)):
        plt.scatter(x=X[y==cl, 0], y=X[y==cl, 1], alpha=0.8, c=cmap(idx), marker=markers[idx],
        label=cl)

def main():
    y = df.iloc[0:100, 4].values
    y = np.where(y == 'Iris-setosa', -1, 1)
    X = df.iloc[0:100, [0, 2]].values

    X_std = np.copy(X)
    X_std[:, 0] = (X_std[:, 0] - X[:, 0].mean()) / X_std[:, 0].std()
    X_std[:, 1] = (X_std[:, 1] - X[:, 1].mean()) / X_std[:, 1].std()

    ada = AdalineGD(n_iter=15, eta=0.01)
    ada.fit(X_std, y)
    plot_decision_regions(X_std, y, classifier=ada)
    plt.title('Adaline - Gradient Descent')
    plt.xlabel('sepal length [standarlized]')
    plt.ylabel('petal length [standarlized]')
    plt.legend(loc='upper left')
    plt.show()
    plt.plot(range(1, len(ada.cost_) + 1), ada.cost_, marker='o')
    plt.xlabel('Epochs')
    plt.ylabel('Sum-squared-error')
    plt.show()


if __name__ == "__main__":
    main()


