以前小弟只有使用過需要付費的 Google Map,也沒有特別找開源地圖,因為最近口罩政策,大家都在開發口罩地圖,於是順便學習一下如何使用~
OpenStreetMap 簡稱 OSM,是採用協作編輯的開源全球地圖,此篇會使用 Leaflet 串接此地圖製作範例
Leaflet 是一個開源 JavaScript 的 library,其主要使用於地圖的繪製,也提供許多方法可使用,用法也相當的簡單,讓我們繪製地圖更加地容易
我們依照官網官網的步驟,依序載入 css 與 js 檔案
<!-- css -->
<link
  rel="stylesheet"
  href="https://unpkg.com/leaflet@1.6.0/dist/leaflet.css"
  integrity="sha512-xwE/Az9zrjBIphAcBb3F6JVqxf46+CDLwfLMHloNu6KEQCAWi6HcDUbeOfBIptF7tcCzusKFjFw2yuvEpDL9wQ=="
  crossorigin=""
/>
<!-- js -->
<script
  src="https://unpkg.com/leaflet@1.6.0/dist/leaflet.js"
  integrity="sha512-gZwIG9x3wUXg2hdXF6+rVkLF/0Vi9U8D2Ntg4Ga5I5BZpVkVxlJWbSQtXPSiUTtC0TjtGOmxa1AJPuV0CPthew=="
  crossorigin="">
</script>
接下來我們建立一個滿版的地圖
<head>
  <style>
    html,body {
      padding: 0;
      margin: 0;
    }
    #myMap {
      width: 100vw;
      height: 100vh;
    }
  </style>
</head>
<body>
  <div id="myMap"></div>
  <script>
    // 設定地圖中心點與放大級別
    const map = L.map("myMap", {
      center: [22.595153, 120.306923],
      zoom: 17
    });
    // 載入圖資
    L.tileLayer("https://{s}.tile.openstreetmap.org/{z}/{x}/{y}.png", {
      attribution: '© <a href="https://www.openstreetmap.org/copyright">OpenStreetMap</a>         contributors'
    }).addTo(map);
    // 彈出視窗
    L.marker([22.595153, 120.306923])
      .addTo(map)
      .bindPopup("夢時代購物中心")
      .openPopup();
    </script>
</body>
成果如下圖~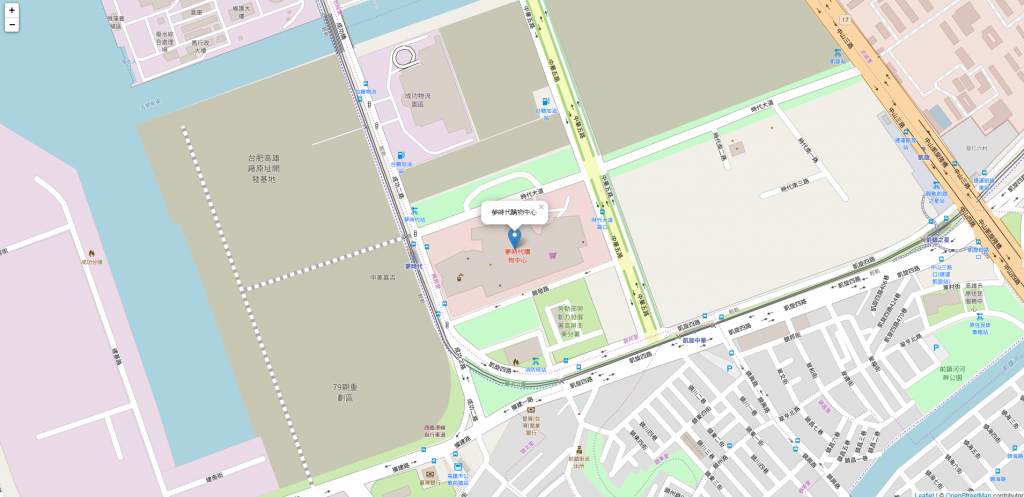
因為可以使用的方法非常多,這邊只介紹簡單常用的,詳細可以看官方文件
此方法用於創建地圖
true
// 範例
const map = L.map("myMap", {
  center: [22.595153, 120.306923],
  zoom: 17,
  zoomControl: false
});
此方法用於載入圖資到地圖內
// 範例
L.tileLayer("https://{s}.tile.openstreetmap.org/{z}/{x}/{y}.png", {
  attribution: '<a href="#">copyright</a>'
  }).addTo(map);
此方法用於客製化標記點 icon
// 範例
const myIcon = L.icon({
  iconUrl: 'my-icon.png',
  iconSize: [38, 95],
  iconAnchor: [22, 94],
  popupAnchor: [-3, -76],
  shadowUrl: 'my-icon-shadow.png',
  shadowSize: [68, 95],
  shadowAnchor: [22, 94]
});
L.marker([50.505, 30.57], {icon: myIcon}).addTo(map);
marker 方法在地圖上創建標記點,bindPopup 方法綁定彈出視窗,openPopup 則是開啟彈跳視窗
[22.595153, 120.306923]
html
// 範例
 L.marker([22.595153, 120.306923], {
    title: "夢時代購物中心",
    icon: myIcon
  })
  .addTo(map)
  .bindPopup("夢時代購物中心")
  .openPopup();
這邊模擬 OpenData 將 JSON 格式依序顯示在地圖上,皆採用 CDN 的方式載入資源
<html>
  <head>
    <!-- 載入 leaflet -->
    <link
      rel="stylesheet"
      href="https://unpkg.com/leaflet@1.6.0/dist/leaflet.css"
      integrity="sha512-xwE/Az9zrjBIphAcBb3F6JVqxf46+CDLwfLMHloNu6KEQCAWi6HcDUbeOfBIptF7tcCzusKFjFw2yuvEpDL9wQ=="
      crossorigin=""
    />
    <style>
      html,
      body {
        padding: 0;
        margin: 0;
      }
      #myMap {
        width: 100vw;
        height: 100vh;
      }
    </style>
  </head>
  <body>
    <div id="myMap"></div>
    <script>
      // 模擬資料
      const data = [
        { name: "夢時代購物中心", local: [22.595153, 120.306923] },
        { name: "漢神百貨", local: [22.61942, 120.296386] },
        { name: "漢神巨蛋", local: [22.669603, 120.302288] },
        { name: "大統百貨", local: [22.630748, 120.318033] }
      ];
      // 設定地圖中心點與放大倍率
      const map = L.map("myMap", {
        center: [22.630748, 120.318033],
        zoom: 13
      });
      // 載入圖資
      L.tileLayer("https://{s}.tile.openstreetmap.org/{z}/{x}/{y}.png", {
        attribution:
          '© <a href="https://www.openstreetmap.org/copyright">OpenStreetMap</a>         contributors'
      }).addTo(map);
      // 創建 icon (金色)
      const goldIcon = new L.Icon({
        iconUrl:
          "https://cdn.rawgit.com/pointhi/leaflet-color-markers/master/img/marker-icon-2x-gold.png",
        shadowUrl:
          "https://cdnjs.cloudflare.com/ajax/libs/leaflet/0.7.7/images/marker-shadow.png",
        iconSize: [25, 41],
        iconAnchor: [12, 41],
        popupAnchor: [1, -34],
        shadowSize: [41, 41]
      });
      // 創建 icon (黑色)
      const blackIcon = new L.Icon({
        iconUrl:
          "https://cdn.rawgit.com/pointhi/leaflet-color-markers/master/img/marker-icon-2x-black.png",
        shadowUrl:
          "https://cdnjs.cloudflare.com/ajax/libs/leaflet/0.7.7/images/marker-shadow.png",
        iconSize: [25, 41],
        iconAnchor: [12, 41],
        popupAnchor: [1, -34],
        shadowSize: [41, 41]
      });
      // 處理資料
      data.forEach(item => {
        // 夢時代購物中心 icon 顯示金色,其餘則為黑色
        let myIcon;
        if (item.name === "夢時代購物中心") {
          myIcon = goldIcon;
        } else {
          myIcon = blackIcon;
        }
        // 添加標記點
        L.marker(item.local, {
          title: item.name,
          icon: myIcon
        })
        .addTo(map)
        .bindPopup(item.name);
      });
    </script>
    <script
      src="https://unpkg.com/leaflet@1.6.0/dist/leaflet.js"
      integrity="sha512-gZwIG9x3wUXg2hdXF6+rVkLF/0Vi9U8D2Ntg4Ga5I5BZpVkVxlJWbSQtXPSiUTtC0TjtGOmxa1AJPuV0CPthew=="
      crossorigin=""
    ></script>
  </body>
</html>
燈冷~~成果如下圖~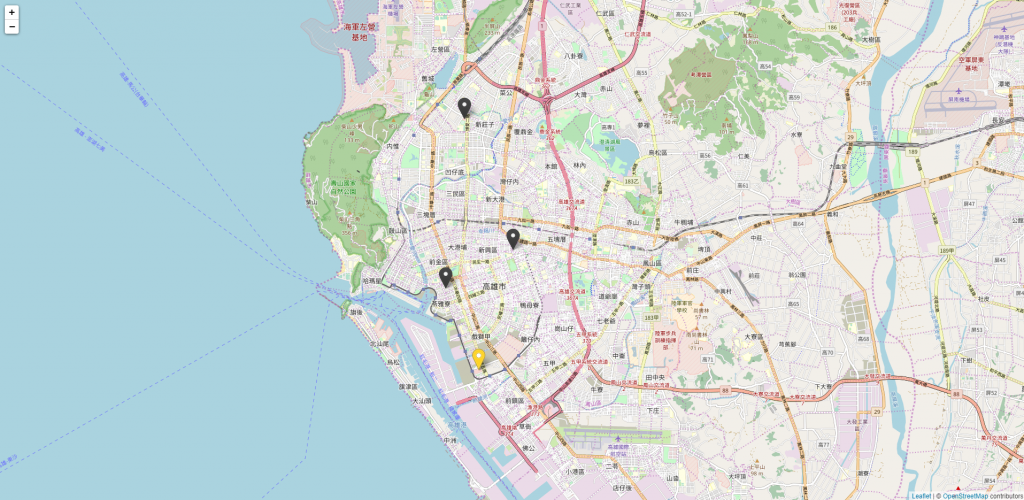
上面的範例只有幾個點,若是真正的 OpenData 可能會有上千個點,一次顯示所有的點效能會非常低落,所以這邊要介紹 markercluster 這個插件,此插件為圖層的概念,依照放大級別將標記點整合成一個群組,並放置於創建的圖層上,使用的方法也相當簡單,這邊使用 CDN 做示範,依序載入 css 與 js 檔案
<!-- css -->
<link
  rel="stylesheet"
  href="https://unpkg.com/leaflet.markercluster@1.4.1/dist/MarkerCluster.css"
/>
<link
  rel="stylesheet"
  href="https://unpkg.com/leaflet.markercluster@1.4.1/dist/MarkerCluster.Default.css"
/>
<!-- js -->
<script src="https://unpkg.com/leaflet.markercluster@1.4.1/dist/leaflet.markercluster.js"></script>
處理資料的部分須要改寫一下,其餘大部分皆相同
// 宣告一個圖層
const markers = new L.MarkerClusterGroup().addTo(map);

// 處理資料
data.forEach(item => {
  // icon 部分
  let myIcon;
  if (item.name === "夢時代購物中心") {
    myIcon = goldIcon;
  } else {
    myIcon = blackIcon;
  }
  // 將標記點新增於圖層
  markers.addLayer(
    L.marker(item.local, {
      title: item.name,
      icon: myIcon
    })
    .addTo(map)
    .bindPopup(item.name)
  );
});
最後就可以看到成果啦~~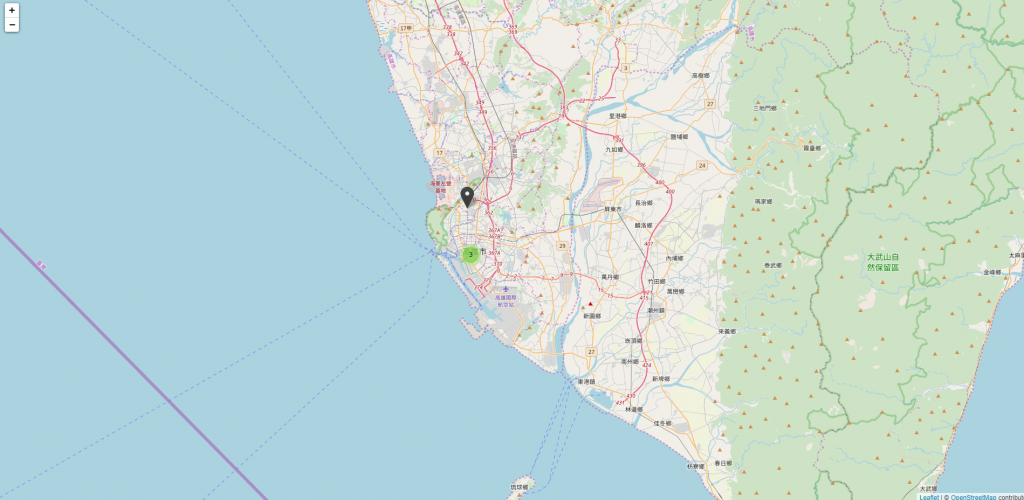
小弟一開始只有用過 google map,經過這次用下來發現,其實地圖的應用都大同小異,只要了解基礎的原理,後面要去學習其他的東西都非常的快速唷!
 Ares
Ares

 iThome鐵人賽