WebGIS基本功能系列來到第三天了,今天沒有什麼遠大的目標,就是把圖面量測小工具搞定而已!
Openlayers的圖面量測官網範例
基本上今天的小功能也是從官網範例修改而來的
免不了的起手式,我們先來開頁面,開發之前應該要先對功能的架構與頁面進行規劃,整體考量過再來進行開發會更上手,我自己是會拿一張白紙來畫介面&操作流程圖,再去跟PM討論功能是否符合要求,接下來就可以照著自己規劃的內容一步步開發完成! 先不考慮滾動式開發這部分
建立MapMeasure.html頁面
<!DOCTYPE html>
<html>
<head>
    <meta charset="utf-8" />
    <title></title>
    <style>
        button.ui.button {
            margin: 10px 0px 10px 0px;
            font-family: 'Microsoft JhengHei';
        }
    </style>
</head>
<body>
    <h2>圖面測量</h2>
    <div>
        <div id="measureBtn" class="ui segment">
            <button type="button" id="measureLineBtn" value="length" class="fluid ui primary basic button">量測距離</button>
            <button type="button" id="measureAreaBtn" value="area" class="fluid ui primary basic button">量測面積</button>
        </div>
        <div>
            <button type="button" id="clearMeasureDrawBtn" value="area" class="fluid ui negative button">清除全部量測標示</button>
        </div>
    </div>
    <script type="text/javascript" src="map_module/widget/BasicTool/jMapMeasure.js"></script>
    <script>
    </script>
</body>
</html>
參數定義起來!
以下功能寫在jMapMeasure.js
//現階段繪圖的參數
var sketch;
//提示框的 Element
var helpTooltipElement;
//幫助繪圖的提示框訊息
var helpTooltip;
//測量工具提示框 Element.
var measureTooltipElement;
//測量工具在量測時顯示的數據值
var measureTooltip;
//繪製多邊形的繪圖題示
var continuePolygonMsg = 'Click to continue drawing the polygon';
//繪製線段的繪圖題示
var continueLineMsg = 'Click to continue drawing the line';
//滑鼠移動的處理函數
var pointerMoveHandler = function (evt) {
    if (evt.dragging) {
        return;
    }
    var helpMsg = 'Click to start drawing';
    if (sketch) {
        var geom = sketch.getGeometry();
        if (geom instanceof ol.geom.Polygon) {
            helpMsg = continuePolygonMsg;
        } else if (geom instanceof ol.geom.LineString) {
            helpMsg = continueLineMsg;
        }
    }
    helpTooltipElement.innerHTML = helpMsg;
    helpTooltip.setPosition(evt.coordinate);
    helpTooltipElement.classList.remove('hidden');
};
var typeSelect;
var draw; // global so we can remove it later
//Format length output.
var formatLength = function (line) {
    var length = line.getLength(line);
    var output;
    if (length > 100) {
        output = (Math.round(length / 1000 * 100) / 100) +
            ' ' + 'km';
    } else {
        output = (Math.round(length * 100) / 100) +
            ' ' + 'm';
    }
    return output;
};
//Format area output.
var formatArea = function (polygon) {
    var area = polygon.getArea(polygon);
    var output;
    if (area > 10000) {
        output = (Math.round(area / 1000000 * 100) / 100) +
            ' ' + 'km<sup>2</sup>';
    } else {
        output = (Math.round(area * 100) / 100) +
            ' ' + 'm<sup>2</sup>';
    }
    return output;
};
判斷用於量測的layer是否已存在,若不存在則建立一個,id為measureVectorLyr,並設定其填充樣式fill、外框樣式stroke,最後加到map當中
if (map.e_getLayer("measureVectorLyr") === undefined) {
    var source = new ol.source.Vector();
    var vector = new ol.layer.Vector({
        source: source,
        style: new ol.style.Style({
            fill: new ol.style.Fill({
                color: 'rgba(255, 255, 255, 0.2)'
            }),
            stroke: new ol.style.Stroke({
                color: '#ffcc33',
                width: 2
            }),
            image: new ol.style.Circle({
                radius: 7,
                fill: new ol.style.Fill({
                    color: '#ffcc33'
                })
            })
        })
    });
    source.id = "measureSourceLyr";
    vector.id = "measureVectorLyr";
    map.addLayer(vector);
}
toolbar、註解的建立都是要分開建的,量測其實就是繪圖+計算Geometry資料、最後將資訊標註在圖面上
撰寫建立量測的toolbar ol.interaction.Draw,並設定樣式 ol.style.Style,接著建立MeasureTooltip()、HelpTooltip()。
最後建立當開始量測(繪圖)時drawstart,就即時獲取現在的坐標位置、計算量測參數,並把數據顯示在measureTooltip上。
當繪製完畢後drawend,將最後的數據標註在圖面相對應的位置,並移除draw的toolbar功能、取消鍵盤key的綁定。
function addInteraction() {
    var type = (typeSelect.val() === 'area' ? 'Polygon' : 'LineString');
    draw = new ol.interaction.Draw({
        source: source,
        type: type,
        style: new ol.style.Style({
            fill: new ol.style.Fill({
                color: 'rgba(255, 255, 255, 0.2)'
            }),
            stroke: new ol.style.Stroke({
                color: 'rgba(0, 0, 0, 0.5)',
                lineDash: [10, 10],
                width: 2
            }),
            image: new ol.style.Circle({
                radius: 5,
                stroke: new ol.style.Stroke({
                    color: 'rgba(0, 0, 0, 0.7)'
                }),
                fill: new ol.style.Fill({
                    color: 'rgba(255, 255, 255, 0.2)'
                })
            })
        })
    });
    map.addInteraction(draw);
    // 建立量測註解
    createMeasureTooltip();
    // 建立說明註解
    createHelpTooltip();
    var listener;
    draw.on('drawstart',
        function (evt) {
            // set sketch
            sketch = evt.feature;
            var tooltipCoord = evt.coordinate;
            listener = sketch.getGeometry().on('change', function (evt) {
                var geom = evt.target;
                var output;
                if (geom instanceof ol.geom.Polygon) {
                    output = formatArea(geom);
                    tooltipCoord = geom.getInteriorPoint().getCoordinates();
                } else if (geom instanceof ol.geom.LineString) {
                    output = formatLength(geom);
                    tooltipCoord = geom.getLastCoordinate();
                }
                measureTooltipElement.innerHTML = output;
                measureTooltip.setPosition(tooltipCoord);
            });
        }, this);

    draw.on('drawend',
        function () {
            measureTooltipElement.className = 'tooltip tooltip-static';
            measureTooltip.setOffset([0, -7]);
            // unset sketch
            sketch = null;
            // unset tooltip so that a new one can be created
            measureTooltipElement = null;
            createMeasureTooltip();
            //查詢每次限制只查一次
            typeSelect.addClass("basic");
            map.removeInteraction(draw);
            //解綁鍵盤key
            ol.Observable.unByKey(listener);
        }, this);
}
建立help tooltip標註提示功能createHelpTooltip()、measure tooltip標註提示功能createMeasureTooltip()
//Creates a new help tooltip
function createHelpTooltip() {
    if (helpTooltipElement) {
        helpTooltipElement.parentNode.removeChild(helpTooltipElement);
    }
    helpTooltipElement = document.createElement('div');
    helpTooltipElement.className = 'tooltip hidden';
    helpTooltip = new ol.Overlay({
        element: helpTooltipElement,
        offset: [15, 0],
        positioning: 'center-left'
    });
    map.addOverlay(helpTooltip);
}

//Creates a new measure tooltip
function createMeasureTooltip() {
    if (measureTooltipElement) {
        measureTooltipElement.parentNode.removeChild(measureTooltipElement);
    }
    measureTooltipElement = document.createElement('div');
    measureTooltipElement.className = 'tooltip tooltip-measure';
    measureTooltip = new ol.Overlay({
        element: measureTooltipElement,
        offset: [0, -15],
        positioning: 'bottom-center'
    });
    map.addOverlay(measureTooltip);
}
冗長css的部分
.tooltip {
    position: relative;
    background: rgba(0, 0, 0, 0.5);
    border-radius: 4px;
    color: white;
    padding: 4px 8px;
    opacity: 0.7;
    white-space: nowrap;
}

.tooltip-measure {
    opacity: 1;
    font-weight: bold;
}

.tooltip-static {
    background-color: #ffcc33;
    color: black;
    border: 1px solid white;
}

    .tooltip-measure:before,
    .tooltip-static:before {
        border-top: 6px solid rgba(0, 0, 0, 0.5);
        border-right: 6px solid transparent;
        border-left: 6px solid transparent;
        content: "";
        position: absolute;
        bottom: -6px;
        margin-left: -7px;
        left: 50%;
    }

    .tooltip-static:before {
        border-top-color: #ffcc33;
    }
接下來就是處理介面的部分,讓點擊按鈕後的顏色有不一樣的呈現,在Semantic UI就是加一個叫basic class就可以了,再次點擊按鈕即可取消量測繪圖。最後建立清除圖面量測layer的功能。
下圖為點擊量測距離按鈕後呈現的顏色差異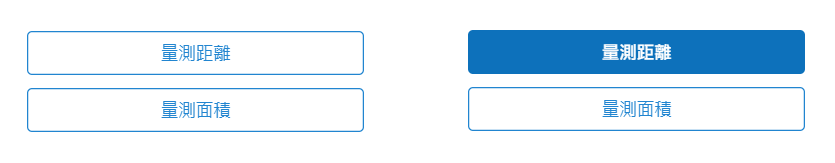
$("#measureBtn button").click(function () {
    typeSelect = $(this);
    if ($(this).hasClass("basic")) {
        $(this).siblings("button").each(function (index, item) {
            if (!$(item).hasClass("basic")) {
                $(item).addClass("basic");
            }
        });
        map.removeInteraction(draw);
        addInteraction();
        $(this).removeClass("basic");
    } else {
        $(this).addClass("basic");
        map.removeInteraction(draw);
    }
});

$("#clearMeasureDrawBtn").click(function () {
    map.e_getLayer("measureVectorLyr").getSource().clear();
    map.getOverlays().clear();
});
搞定拉!!!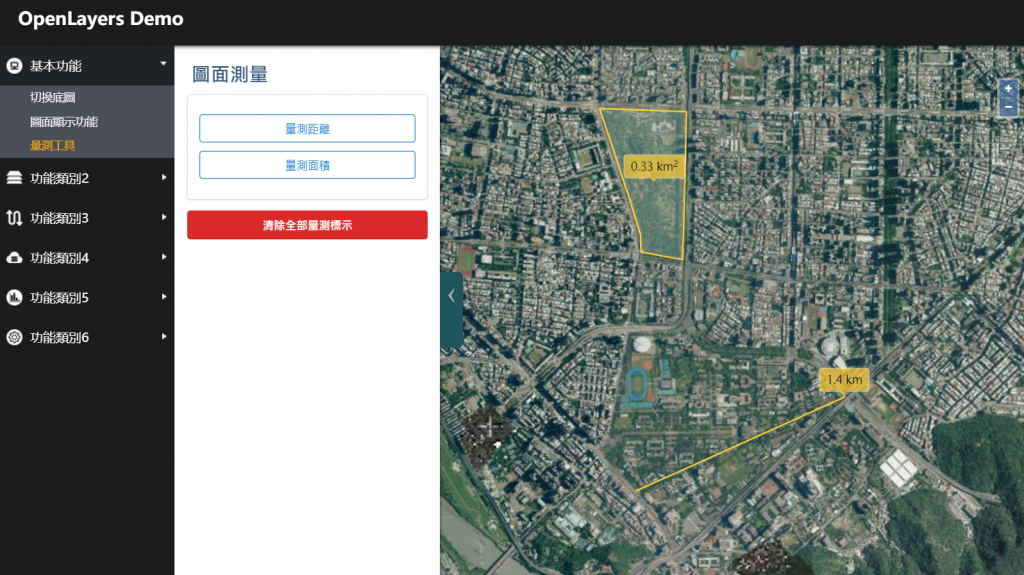
你以為這樣就結束了嗎?
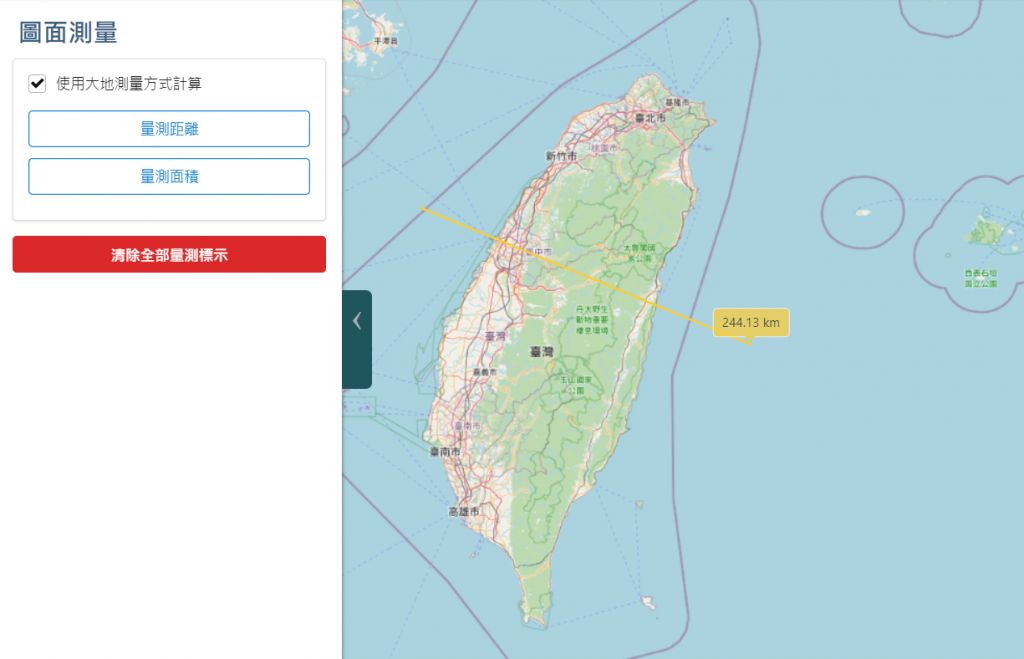
還沒完,還有球面距離量測這個選擇!我們一般的地圖常常都是使用投影後的坐標系統如:EPSG:3826、EPSG:3857,比較少會直接用經緯度坐標EPSG:4326,因為它比較難呈現投影後的結果。
<div class="ui checkbox">
	<input type="checkbox" name="example" id="useGeodesic">
	<label>使用大地測量方式計算</label>
</div>
接下來就是修改之前建立的formatLength、formatArea這兩個取得距離和面積的function,將我們現在的坐標系統EPSG:3857轉換到大地坐標經緯度EPSG:4326後,設定地球半徑為63781387km,去計算球面距離與球面面積。
基本上,球面的距離通常會比投影距離還要長,而且量測的距離越長會越明顯。
var geodesicCheckbox;
geodesicCheckbox = $("#useGeodesic");

//Format length output.
var formatLength = function (line) {
    //var length = line.getLength(line);
    var length;
    if (geodesicCheckbox.prop("checked")) {//use geodesic
        var sourceProj = map.getView().getProjection();
        length = ol.sphere.getLength(line, { "projection": sourceProj, "radius": 6378137 });
    } else {
        length = line.getLength(line);
    }
    console.log("proj:" + ol.sphere.getLength(line, { "projection": sourceProj, "radius": 6378137 }) + ",default:" + line.getLength(line))
    var output;
    if (length > 100) {
        output = (Math.round(length / 1000 * 100) / 100) + ' ' + 'km';
    } else {
        output = (Math.round(length * 100) / 100) + ' ' + 'm';
    }
    return output;
};

//Format area output.
var formatArea = function (polygon) {
    //var area = polygon.getArea(polygon);
    var area;
    if (geodesicCheckbox.prop("checked")) {//use geodesic
        var sourceProj = map.getView().getProjection();
        var geom = polygon.clone().transform(sourceProj, 'EPSG:4326'); //投影為EPSG:4326
        area = Math.abs(ol.sphere.getArea(geom, { "projection": sourceProj, "radius": 6378137 }));
    } else {
        area = polygon.getArea();
    }
    var output;
    if (area > 10000) {
        output = (Math.round(area / 1000000 * 100) / 100) + ' ' + 'km<sup>2</sup>';
    } else {
        output = (Math.round(area * 100) / 100) + ' ' + 'm<sup>2</sup>';
    }
    return output;
};
若對坐標系統很沒概念的話,後面會有一章節在講坐標系統的部分,可以那時候再進一步理解,畢竟坐標系統是做GIS的重要環節,大家要保持對坐標系統的敏感度!
今天只有學了一個功能,就是圖面量測工具的建立,雖然只有一個但是內容也不少呢!
我們已經完整學完WebGIS的基本系列了
我們休息一下,明天不寫程式改來學知識,為了未來鋪路。明天我們來探討GIS的資料到底有哪些常用的格式吧!