今天將分析一下昨天訓練完的模型,先從載入昨天訓練好的模型開始。
from tensorflow.keras.models import load_model
model = load_model('mnist_model.h5')
接著載入測試集,請確保資料的輸入格式與訓練時一致,要經過一樣的預處理步驟,才開始進行推論,延續昨天程式的人可以跳過這一步。
from tensorflow.keras.datasets import mnist

(x_train, y_train), (x_test, y_test) = mnist.load_data()
x_test = x_test.reshape(10000, 784)
x_test = x_test / 255
接著我們對測試集進行預測,並把輸出的y_predict從One-Hot轉回0~9的表現形式,如果你是延續昨天的程式並沒有重新讀取y_test的話,也要進行轉換。
y_predict = model.predict(x_test)
import numpy as np
y_predict = np.argmax(y_predict, axis=1)
# y_test = np.argmax(y_test, axis=1)
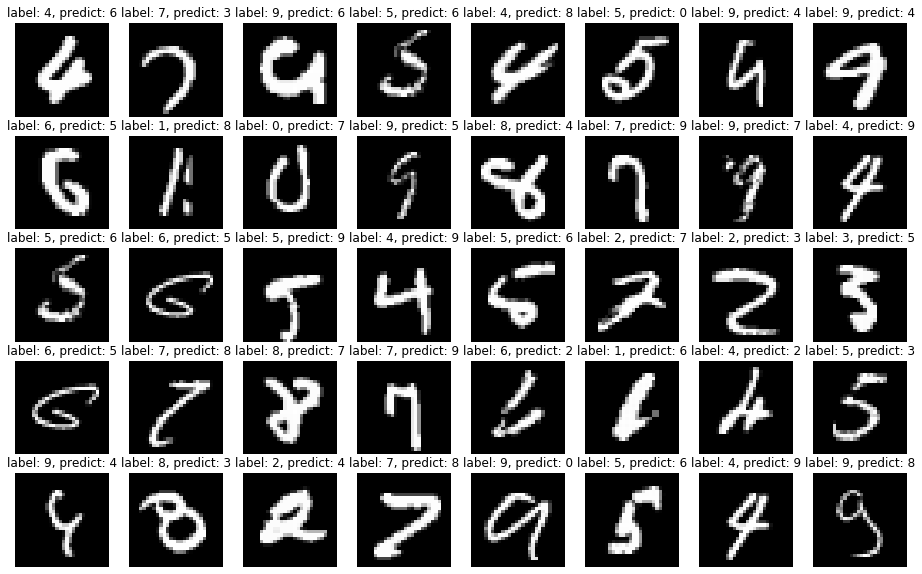
我們隨機選取40張推論錯誤的圖出來看一下。
import matplotlib.pyplot as plt
from random import choice

wrong = np.not_equal(y_predict, y_test)
label = np.arange(*y_test.shape)[wrong]

plt.figure(figsize=(16,10),facecolor='w')
for i in range(5):
  for j in range(8):
    index = choice(label)
    plt.subplot(5, 8, i*8+j+1)
    plt.title("label: {}, predict: {}".format(y_test[index], y_predict[index]))
    plt.imshow(x_test[index].reshape(28,28), plt.cm.gray)
    plt.axis('off')

plt.show()
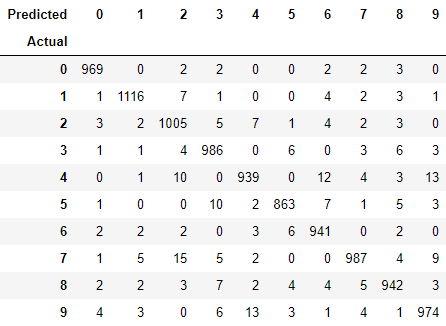
使用pandas這個數值分析的套件生成一個混淆矩陣觀察一下哪個數字被誤判的次數比較高,沒有的話就裝一下。
import pandas as pd # pip install pandas
df = pd.DataFrame({'y_Actual': y_test, 'y_Predicted': y_predict})
pd.crosstab(df['y_Actual'], df['y_Predicted'], rownames=['Actual'], colnames=['Predicted'])