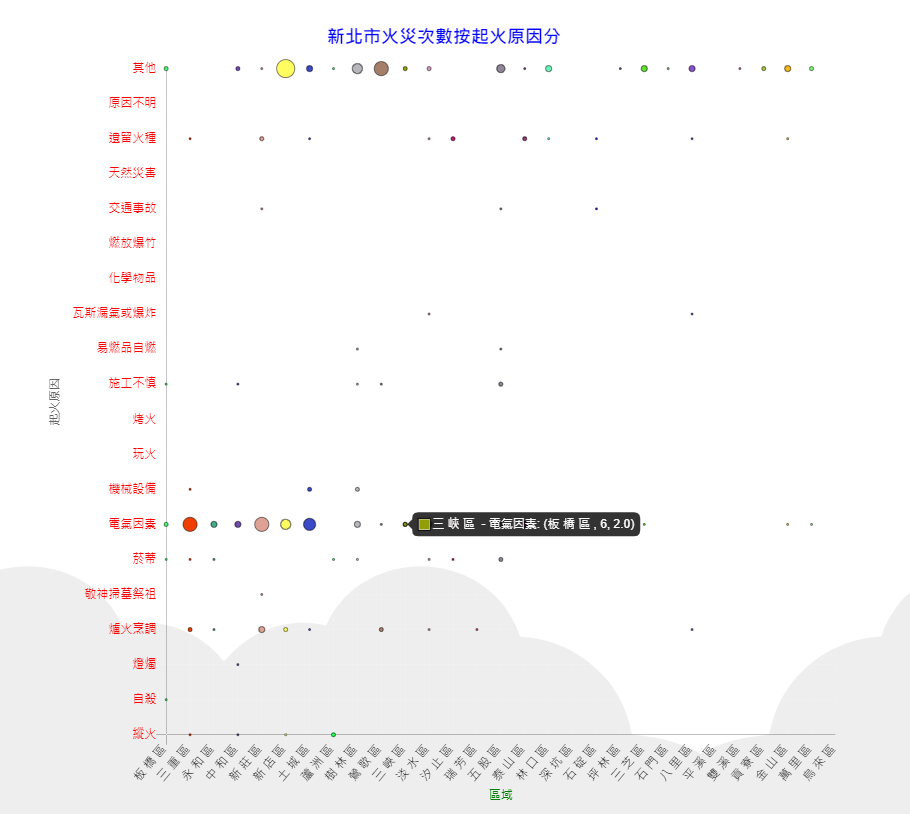
結果
資料來源
JSON - 範例使用
API (會有 CORS 問題)
SWAGGER
程式碼
chart.component.html
<canvas baseChart width="800" height="800"
[datasets]="ChartData"
[labels]="ChartLabels"
[options]="ChartOptions"
[plugins]="ChartPlugins"
[colors]="ChartColors"
[legend]="ChartLegend"
[chartType]="ChartType">
</canvas>
chart.component.ts
import { HttpClient } from '@angular/common/http';
import { Component, OnInit } from '@angular/core';
import { ChartDataSets, ChartOptions, ChartType } from 'chart.js';
import { Color, Label } from 'ng2-charts';

export enum FireApiType {
  area = '區域別',
  total = '總計',
  arson = '縱火',
  suicide = '自殺',
  light_candle =  '燈燭',
  fire =  '爐火烹調',
  worship = '敬神掃墓祭祖',
  cigarette = '菸蒂',
  electric = '電氣因素',
  mechanical = '機械設備',
  play_with_fire = '玩火',
  roasted_fire = '烤火',
  construction_inadvertently = '施工不慎',
  spontaneous_combustion = '易燃品自燃',
  gas_leak_or_explosion = '瓦斯漏氣或爆炸',
  chemical_materials = '化學物品',
  fireworks = '燃放爆竹',
  traffic_accident = '交通事故',
  natural_disaster = '天然災害',
  left_the_fire =  '遺留火種',
  unknown_reason =  '原因不明',
  other =  '其他',
}

export enum FireType {
  '縱火',
  '自殺',
  '燈燭',
  '爐火烹調',
  '敬神掃墓祭祖',
  '菸蒂',
  '電氣因素',
  '機械設備',
  '玩火',
  '烤火',
  '施工不慎',
  '易燃品自燃',
  '瓦斯漏氣或爆炸',
  '化學物品',
  '燃放爆竹',
  '交通事故',
  '天然災害',
  '遺留火種',
  '原因不明',
  '其他',
}

export interface FireIF {
  area: string;
  total: number;
  arson: number;
  suicide: number;
  light_candle: number;
  fire: number;
  worship: number;
  cigarette: number;
  electric: number;
  mechanical: number;
  play_with_fire: number;
  roasted_fire: number;
  construction_inadvertently: number;
  spontaneous_combustion: number;
  gas_leak_or_explosion: number;
  chemical_materials: number;
  fireworks: number;
  traffic_accident: number;
  natural_disaster: number;
  left_the_fire: number;
  unknown_reason: number;
  other: number;
}

@Component({
  selector: 'app-chart',
  templateUrl: './chart.component.html',
  styleUrls: ['./chart.component.scss']
})
export class ChartComponent implements OnInit {

  // 圖表數值資料
  public ChartData: ChartDataSets[] = [];

  // 圖表項目
  ChartOptions: ChartOptions = {
    title: {
      fontSize: 18,
      display: true,
      text: '新北市火災次數按起火原因分',
      position: 'top',
      padding: 20,
    },
    responsive: true,
    scales: {
      yAxes: [{
        // offset: true, // 是否 移除 X軸 的 底線
        scaleLabel: {
          display: true,
          labelString: '起火原因',
        },
        ticks: {
          beginAtZero: true,
          stepSize: 1, // 間隔數字; 1
          callback: label => `${FireType[label]}` // 將數字轉換成任意格式
        },
        type: 'linear',

      }],
      xAxes: [{
        scaleLabel: {
          display: true,
          labelString: '區域',
        },
        type: 'category', // 用來顯示 文字
      }],

    },
    animation: {
      duration: 1000 // 動畫移動速度
    }
  };
  // 各個區塊的顏色
  ChartColors: Color[] = [];
  ChartLabels: Label[] = []; // X軸標籤
  ChartType: ChartType = 'bubble'; // 圖表類型
  ChartLegend = false; // 是否開啟 顏色標籤對照表
  ChartPlugins = []; // 外掛套件


  constructor(
    private httpClient: HttpClient
  ) { }

  ngOnInit(): void {
    // 先載好 JSON 資料
    this.httpClient.get('./assets/preview.json').subscribe( (res: FireIF[]) => {

      this.ChartLabels = [];
      this.ChartData = [];
      this.ChartColors = [];

      res.forEach( (r, index) => {
        if (index === 0) { return; }

        // 先建立行政區的顏色 於 各火災類型放置
        const color = getRandomColor();

        // 把行政區的每個火災類型 生成一個數據
        Object.keys(r).forEach( (o, o_index) => {
          // 過濾掉地區(area)和總數(total)
          if (o_index <= 1) { return; }
          this.ChartData.push({data: [{ x: r.area, y: o_index - 2 , r: r[o] }], label: `${r.area} - ${FireApiType[o]}` });
          this.ChartColors.push({
            borderWidth: .5, // 有外框寬度才能顯示外框
            borderColor: '#000', // 提示標籤的顏色提示外框顏色
            backgroundColor: color, // 圖表個別區塊顏色
          });
        });

        this.ChartLabels.push(r.area);
      });
    });
  }

}

function getRandomColor() {
  const letters = '0123456789ABCDEF';
  let color = '#';
  for (let i = 0; i < 6; i++) {
    color += letters[Math.floor(Math.random() * 16)];
  }
  return color;
}