iT邦幫忙

第 12 屆 iThome 鐵人賽

DAY 27
0
Modern Web

Angular10 實作教學系列 第 27

NG10鐵人賽 - 27 - ng2-charts github 導讀

  • 分享至 

  • xImage
  •  

安裝套件

cmd

npm install ng2-charts@2.4.1 --save
npm install chart.js --save

各種圖表展示範例

Line Chart - 折線圖
https://stackblitz.com/edit/ng2-charts-line-template
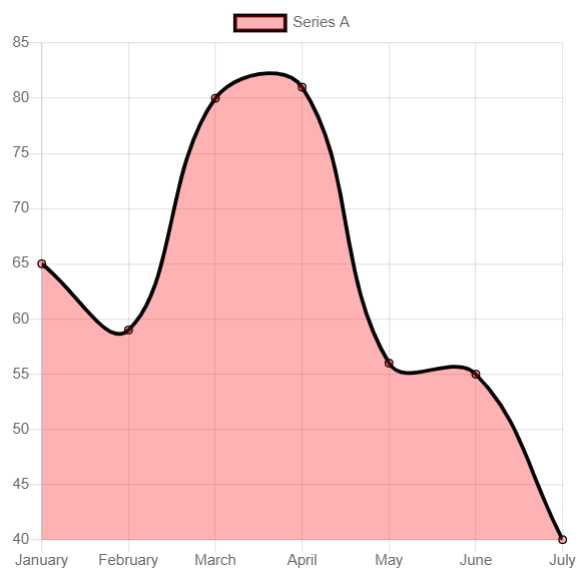
https://ithelp.ithome.com.tw/upload/images/20200927/20107754lGa2ABTleP.png

Pie Chart - 圓餅圖
https://stackblitz.com/edit/ng2-charts-pie-template
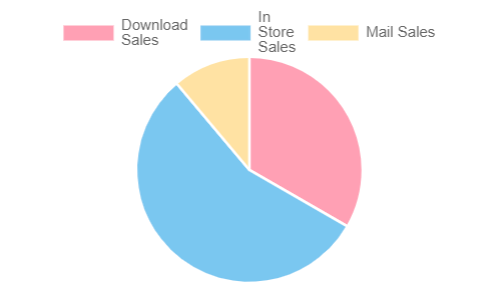
https://ithelp.ithome.com.tw/upload/images/20200927/20107754rt46cxnhGb.png

Bar Chart - 長條圖
https://stackblitz.com/edit/ng2-charts-bar-template
https://ithelp.ithome.com.tw/upload/images/20200927/20107754leo87Ng2gL.png

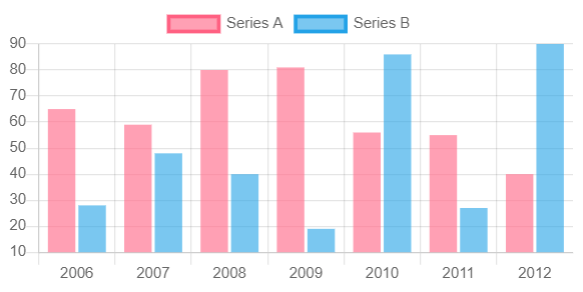
Doughnut Chart - 圓環圖
https://stackblitz.com/edit/ng2-charts-doughnut-template
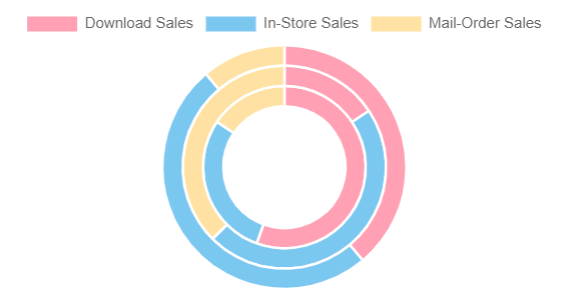
https://ithelp.ithome.com.tw/upload/images/20200927/2010775466jkznkS6C.png

Radar Chart - 雷達圖
https://stackblitz.com/edit/ng2-charts-radar-template
https://ithelp.ithome.com.tw/upload/images/20200927/201077543nL8WOsaTT.png

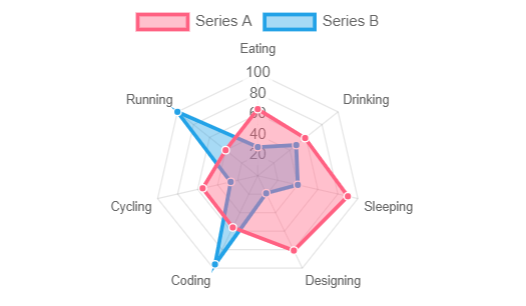
Polar Area Chart - 極面圖(自己想叫圓面圖)
https://stackblitz.com/edit/ng2-charts-polar-area-template
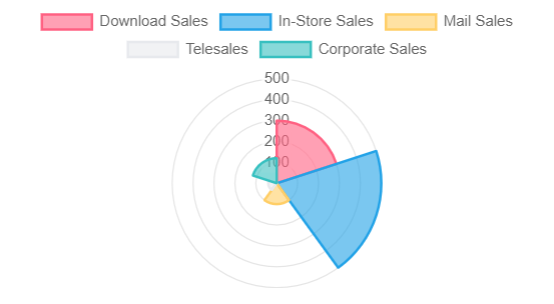
https://ithelp.ithome.com.tw/upload/images/20200927/201077546VGvz875ix.png

Bubble Chart - 泡泡圖
https://stackblitz.com/edit/ng2-charts-bubble-template
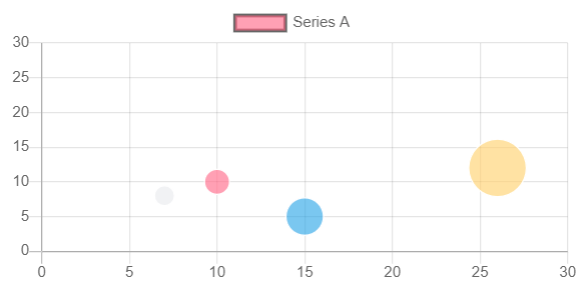
https://ithelp.ithome.com.tw/upload/images/20200927/20107754hpSrdkP9oO.png

Scatter Chart - 分散圖
https://stackblitz.com/edit/ng2-charts-scatter-template
https://ithelp.ithome.com.tw/upload/images/20200927/20107754x22oTXxNfw.png

匯入 Module

app.module.ts

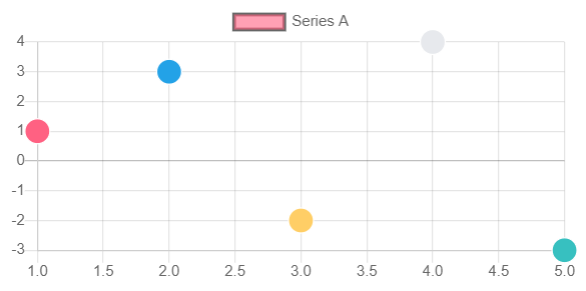
import { ChartsModule } from 'ng2-charts';
// In your App's module:
imports: [
    ChartsModule
]

介紹

圖表型別

所有圖表類型都有一個 directive:baseChart,共八種類型:
line, bar, radar, pie, polarArea, doughnut, bubble and scatter

屬性

多數資訊還請參考 chart.js 的文件 http://www.chartjs.org/docs

  • data (SingleOrMultiDataSet) - 設定一組數值給圖表,line, bar, radar and doughnut 使用 MultiDataSet, 其他使用 SingleDataSet
  • datasets ({ data: SingleDataSet, label: string }[]) - label 像是 標題或提示
  • labels (Label[]) - line, bar and radar 一定需要 x 軸提示; polarArea, pie and doughnut 則是在 觸碰到圖表內容才會顯示 x 軸提示;Label 可以是 string 或 string[],representing a multi-line label where each array element is on a new line.
  • chartType (ChartType) - 使用哪種圖表類型:line, bar, radar, pie, polarArea, doughnut (沒有 Scatter Chart - 分散圖 和 Bubble Chart - 泡泡圖)
  • options (ChartOptions) - 圖表項目 參考 http://www.chartjs.org/docs/
  • colors (Color[]) - 資料的顏色 - 沒有特別指定就 隨機給顏色
  • legend: (boolean = false) - 假如是 true,在圖表下方顯示說明

事件

  • chartClick - 當點擊圖表的內容後,回傳 啟用的 分數和提示
  • chartHover - 當滑到圖表的內容後,回傳 啟用的 分數和提示

顏色(Colors)

原本就有設定幾個基礎的顏色,你可以使用 colors attribute 去替換顏色,假如有更多資料需要顏色,會隨機生成

參考來源

https://www.npmjs.com/package/ng2-charts


上一篇
NG10鐵人賽 - 26 - Template-Drive & Reacitve Forms 自訂驗證
下一篇
NG10鐵人賽 - 28 - ng2-charts github 樣板實作
系列文
Angular10 實作教學30
圖片
  直播研討會
圖片
{{ item.channelVendor }} {{ item.webinarstarted }} |
{{ formatDate(item.duration) }}
直播中

尚未有邦友留言

立即登入留言