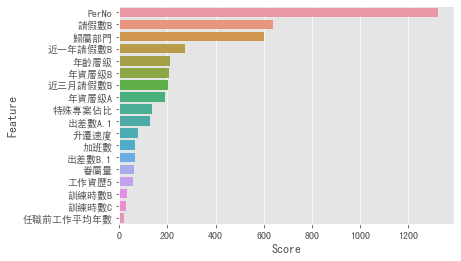
終於進入到視覺化的部分了!雖然現在有很多的繪圖軟體,但我認為初期用python自己畫出圖,可以增強自己的編碼能力。其實視覺化一直都是資料分析很重要的一環,我用下圖舉例,你就可以了解為什麼要做視覺化了。以下是我用卡方分配去挑選重要的特徵,得出來的結果。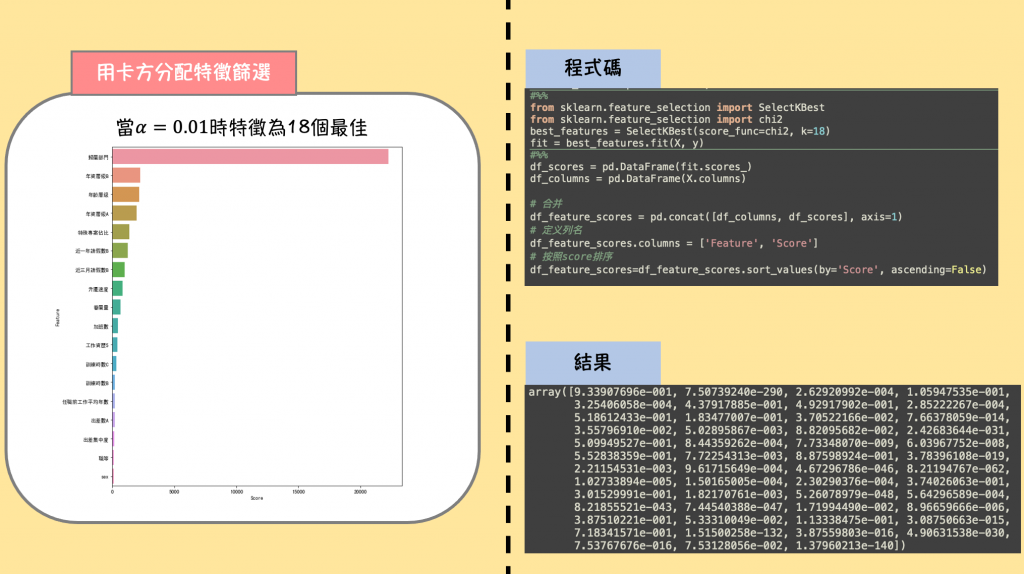
假如你是個大學教授,學生在跟你報告的時候,你希望學生用一張圖解釋在資料中做了什麼發現了什麼(左圖),還是貼出一張程式碼逐行解釋每一行的功用,最後又貼出一張程式碼跑出來的分數(右圖)呢?
我想絕大多數會選擇左圖吧,教授要看到的只是做出來的結果,而不是程式碼怎麼執行的,就算程式coding有多厲害,沒有搭配圖表去解釋你的結果,就不能算是一個好的報告。
有一些基本的統計工具及工具圖必須要先了解,才能在畫圖的時候用對工具。
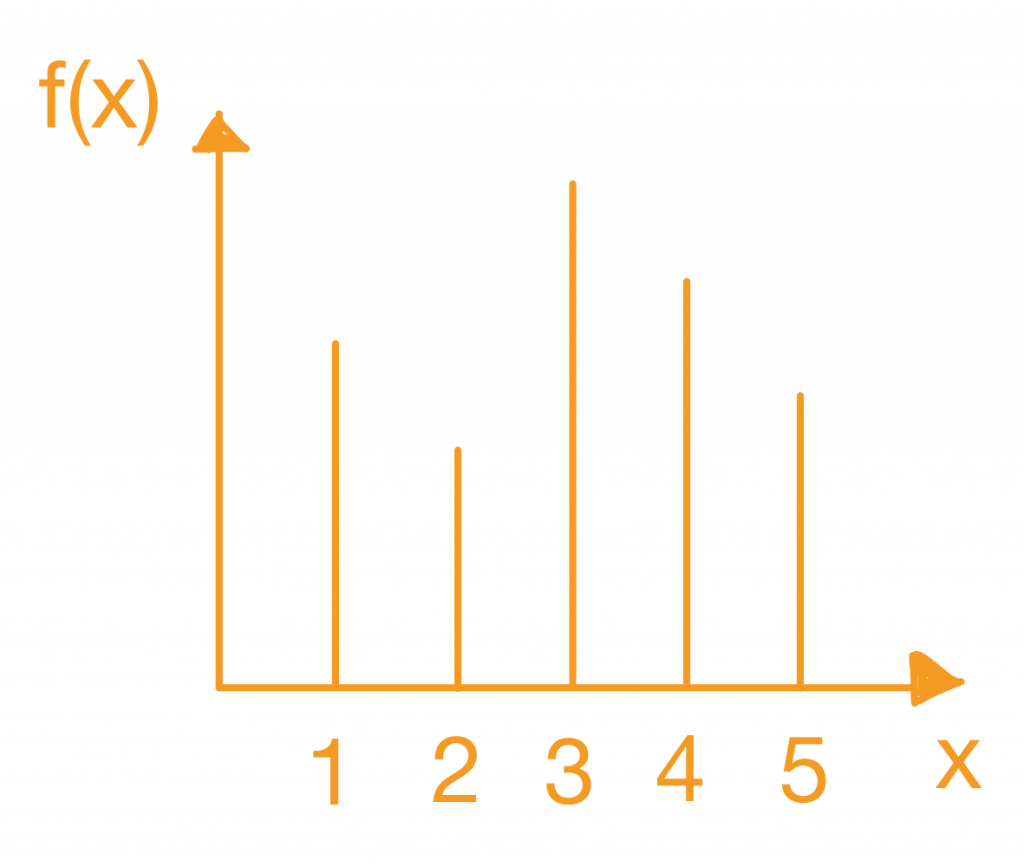
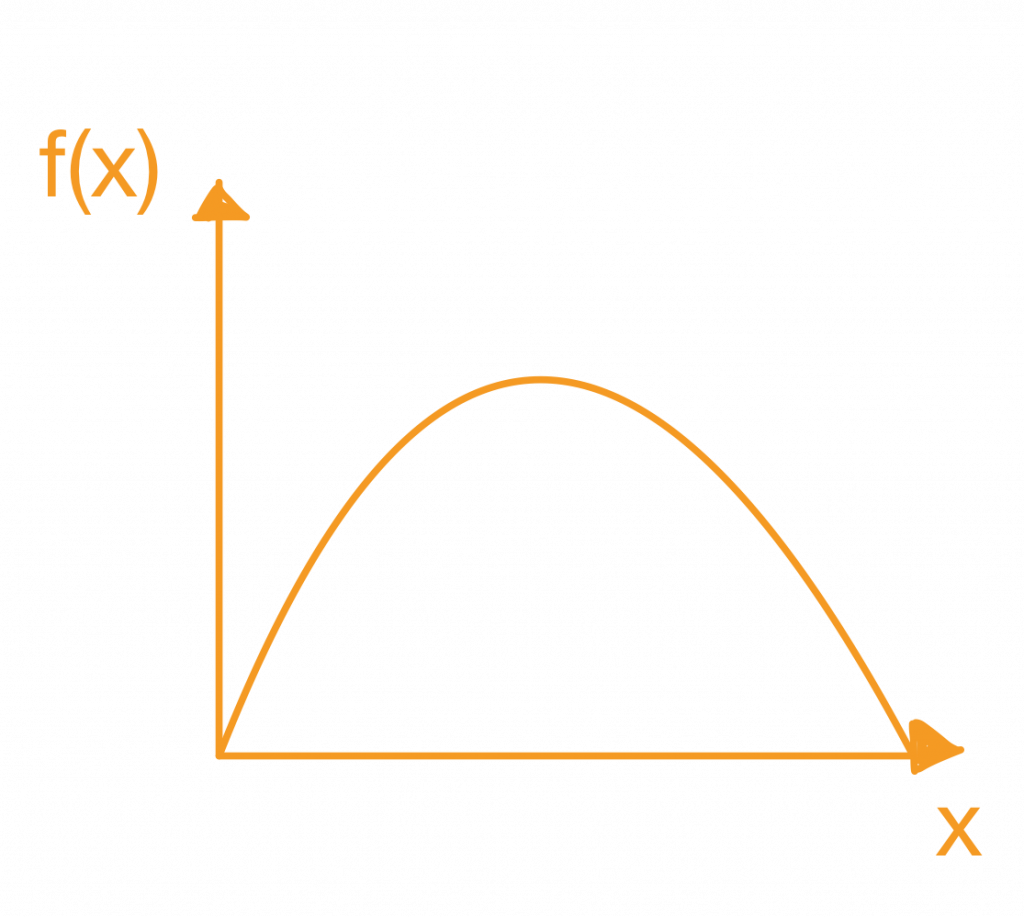
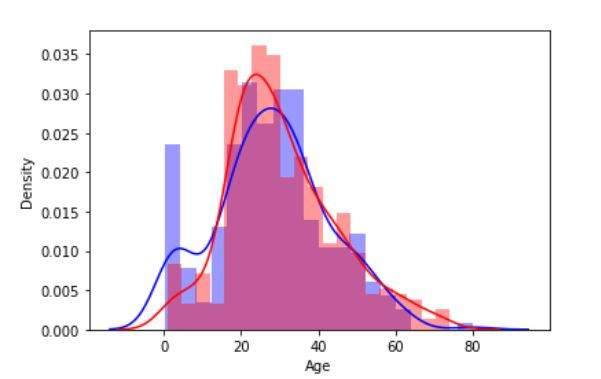
以鐵達尼號資料集為例
資料集來源:https://www.kaggle.com/c/titanic/data
index_survived = (train_df["Age"].isnull()==False)&(train_df["Survived"]==1)
index_died = (train_df["Age"].isnull()==False)&(train_df["Survived"]==0)

sns.distplot( train_df.loc[index_survived ,'Age'], bins=20, color='blue', label='Survived' )
sns.distplot( train_df.loc[index_died ,'Age'], bins=20, color='red', label='Survived' )
以員工離職預測率重要程度為例
資料集來源:https://aidea-web.tw/topic/2f3ee780-855b-4ea7-8fc8-61f26447af1d
import seaborn as sns
fig = plt.figure(figsize=(10,12))         #畫布大小
sns.barplot(a['Score'],a['Feature'])      #前面是X軸你要放的特徵 ,後面是Y軸你要放的東西
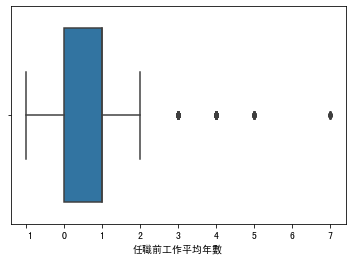
以員工離職預測“任職前工作平均年數”畫出盒鬚圖
可以看到右邊的點即為資料中的離群值
資料集來源:https://www.kaggle.com/djhavera/beijing-pm25-data-data-set
import seaborn as sns
sns.boxplot(train['任職前工作平均年數'])
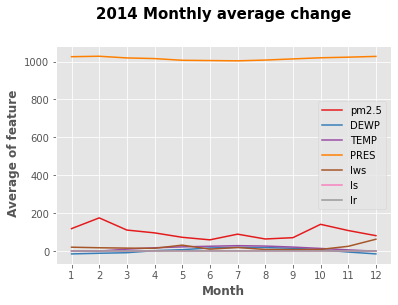
畫出每個天氣特徵月的變化
資料集來源:https://www.kaggle.com/djhavera/beijing-pm25-data-data-set
plt.style.use("ggplot")               # 使用ggplot主題樣式
plt.xticks(day)
#畫第多條線,plt.plot(x, y, c)參數分別為x軸資料、y軸資料、線顏色
plt.plot(e["month"],e["pm2.5"],c = colors[0])
plt.plot(e["month"],e["DEWP"],c = colors[1])
plt.plot(e["month"],e["TEMP"],c = colors[2])
plt.plot(e["month"],e["PRES"],c = colors[3])
plt.plot(e["month"],e["Iws"],c = colors[4])
plt.plot(e["month"],e["Is"],c = colors[5])
plt.plot(e["month"],e["Ir"],c = colors[6])
# 設定圖例,參數為標籤、位置
plt.legend(labels=['pm2.5', 'DEWP', 'TEMP', 'PRES', 'Iws', 'Is','Ir'], loc = 'best')
plt.xlabel("months", fontweight = "bold")                # 設定x軸標題及粗體
plt.ylabel(" Average of feature", fontweight = "bold")    # 設定y軸標題及粗體
plt.title("2014 months average change", fontsize = 15, fontweight = "bold", y = 1.1)
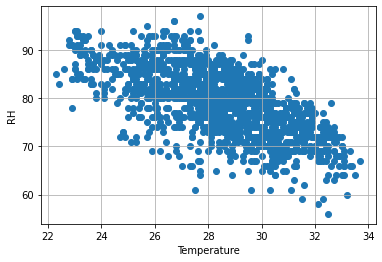
以天氣資料為例,可以看到資料呈現負相關。
資料集來源:https://www.kaggle.com/djhavera/beijing-pm25-data-data-set
plt.scatter(df_weather1["Temperature"],df_weather1["RH"])
plt.xlabel("Temperature") #X軸標簽
plt.ylabel("RH") #Y軸標簽
plt.grid(True)
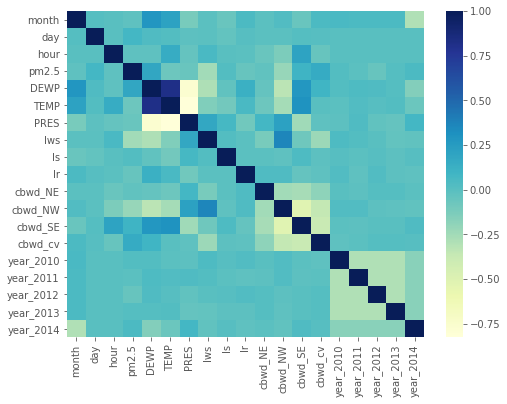
透過相關係數的計算,我們可以將它已圖顯示出來最。可以更快找到資料彼此之間的關聯。
顏色越深代表關聯性越高。
資料集來源:https://www.kaggle.com/djhavera/beijing-pm25-data-data-set
corr_pd = train.corr() #先算出資料間彼此的相關係數
#使用seaborn做視覺化
import seaborn as sns
import matplotlib.pyplot as plt
# 指定畫幅
plt.figure(figsize=(8,6))
# 繪製熱力圖
sns.heatmap(corr_pd, cmap='YlGnBu')
其實網路上有很多大神畫的圖都很漂亮,可以去上面看他們提供的程式碼,去研究他怎麼畫出來的,以下是這些網站的介紹。
