今日我們要來使用Kibana內的警報功能,看如何設定Alert讓我們能收到異常的通知。
首先我們說明一下預計想做的警報器,功能說明: 每分鐘檢查機器的cpu值是否有小於40%。
左選單 Stack Management後,選擇Rules and Connectors,點選Create rule按鈕,準備開始建立警報器。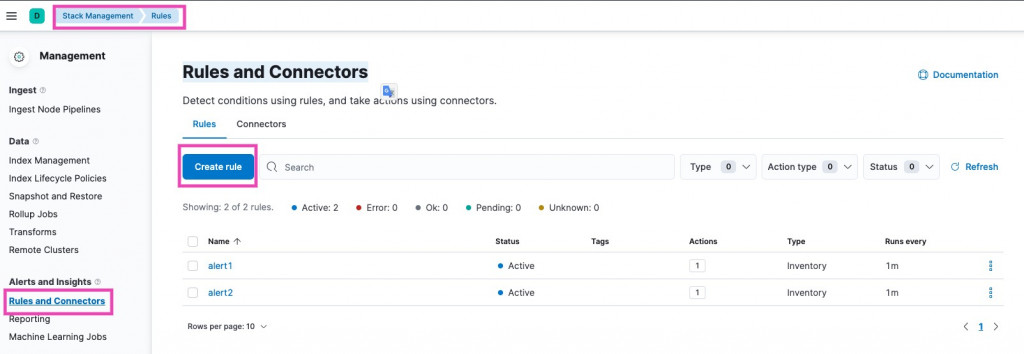
步驟一: 建立名稱it13-alert的警報器,選擇每分鐘檢查一次,並且每分鐘通知。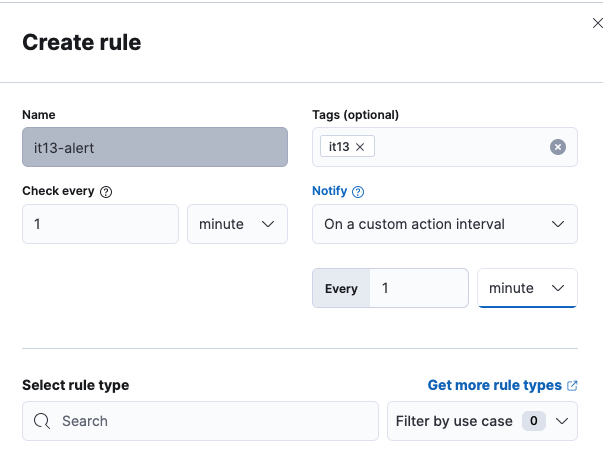
步驟二: 選擇想要觸發的類型:
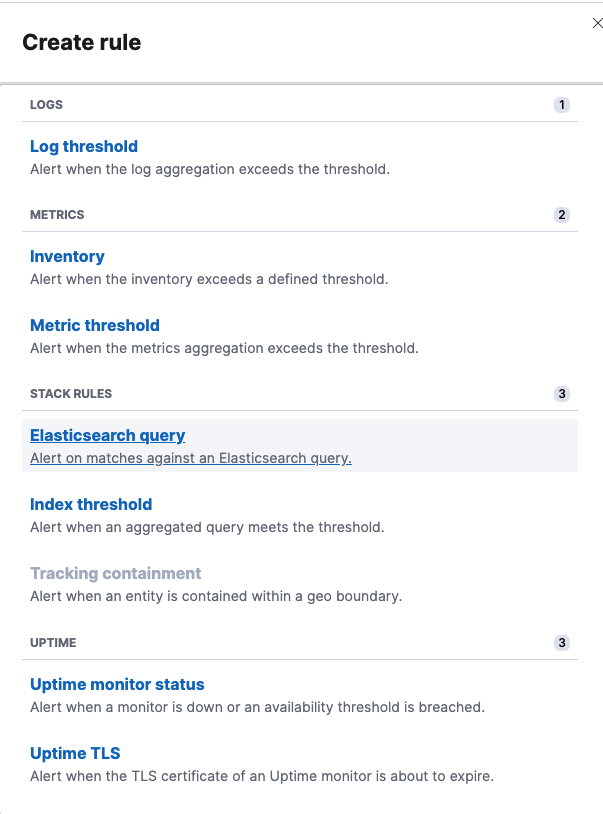
步驟三:這裡我們選Inventory,設定警報觸發的條件。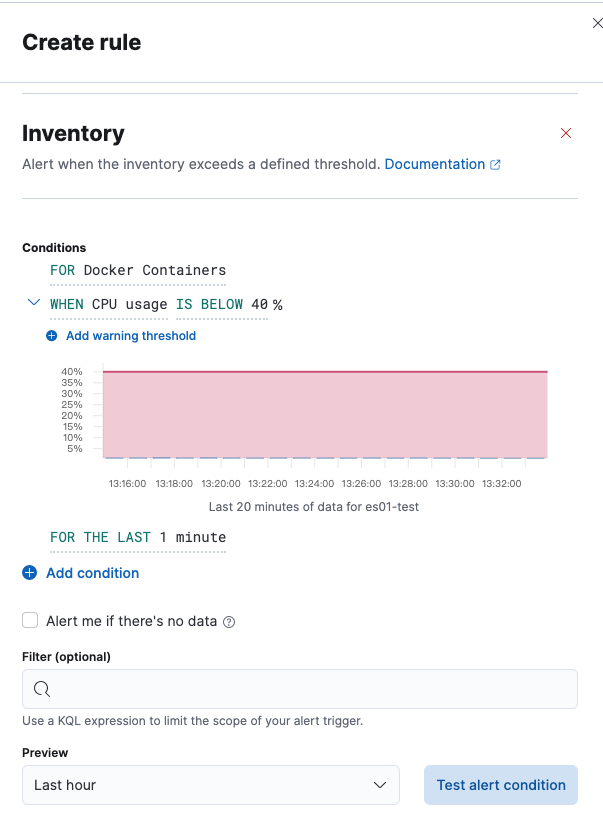
步驟四:Actions設定,免費版本只有Index和Server log。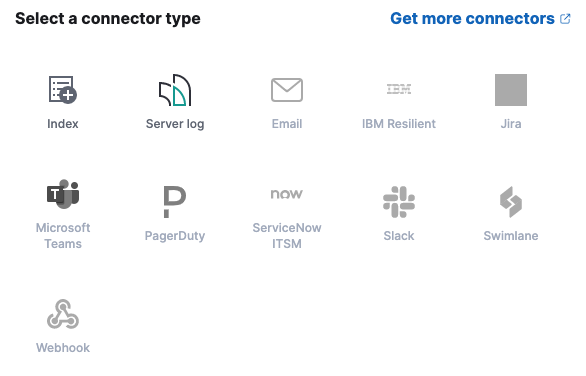
選擇index當做警報發送,開始進Action設定。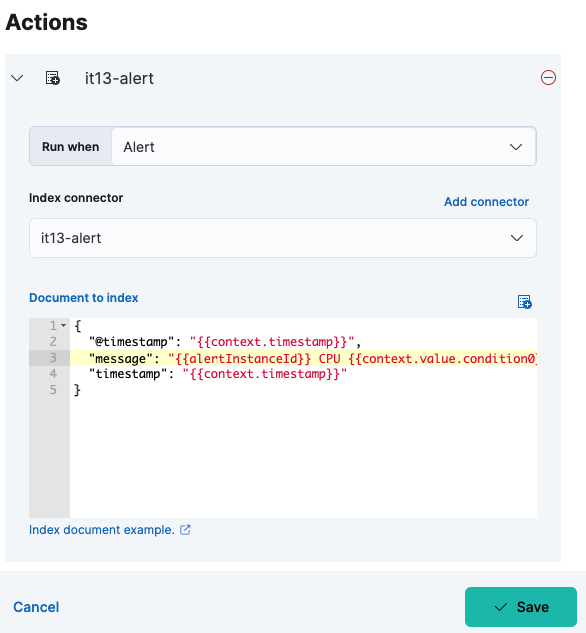
設定connector(it13-alert),建立寫入索引名稱it13-cpu。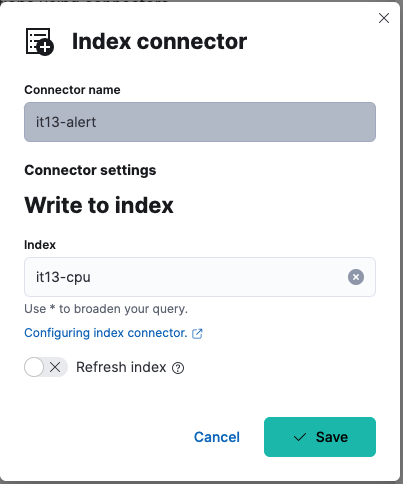
設定警報發送內容,警報樣板格式
{
  "@timestamp": "{{context.timestamp}}",
  "message": "{{alertInstanceId}} CPU {{context.value.condition0}}異常",
  "timestamp": "{{context.timestamp}}"
}
步驟五:存檔後,警報器設定完成。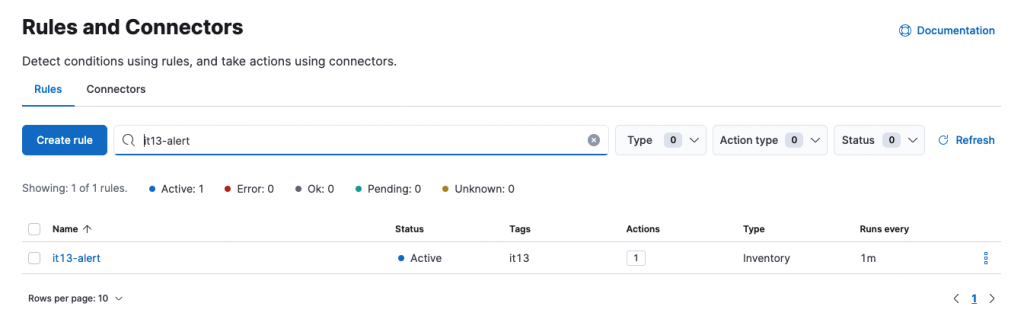
我們來看一下it13-alert警報器觸發後產生的索引it13-cpu資料內容。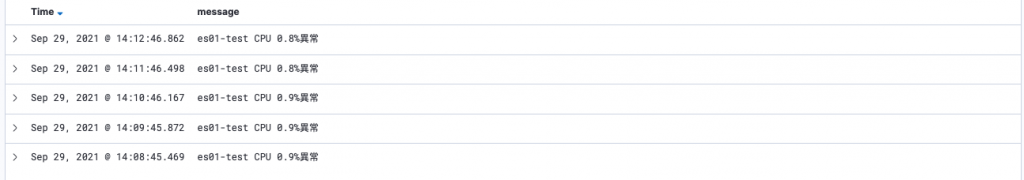


 iThome鐵人賽