我們到政府開放資料平台下載這兩個檔案,第一個是包含各種伴手禮的經緯度資料、名稱、介紹等等作為要畫在地圖上的資料,另一個是台灣地圖的shp檔案,作為繪製地圖用。
我們預計將svg和一個div的class叫做wrap-item放在wrap裡面,然後撰寫css使用flex來進行排版,svg這個容器是要放地圖檔案和農產品的經緯度預計要製作成circle的點狀的樣子來當作該地區有農產品的位置,wrap-item則是我們要顯示這些農產品的名稱、住址、電話、介紹等等的容器,程式碼如下
<style>
.wrap{
    display: flex;
    width: 1440px;
    justify-content: center;
}
svg{
    border:solid 1px  black;
}
</style>
<body>
<div class="wrap">
</div>
let width = 800;
let height = 600;
const projection = d3.geoMercator()
                    .center([123, 24 ])
                    .scale(5000);
const svg = d3.select("body").select(".wrap").append("svg")
                .attr("width", width)
                .attr("height", height);
const path = d3.geoPath()
            .projection(projection);

const g = svg.append("g");
d3.select(".wrap").append("div").classed("wrap-item",true);//選擇class是wrap的元素插入div並且命名為wrap-item
</body>
透過前幾天的教學將shp檔案轉換至topojson檔案後,接下來我們載入地圖的資料
d3.json("taiwantopo.json").then(function(topology) {
    console.log(topology);
});
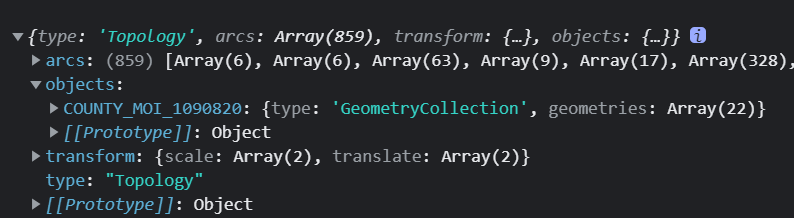
一樣我們先觀察轉換後的topojson的哪一個部分是我們需要的東西。
如下圖objects裡面的COUNTY_MOI_1090820是我們需要的東東西
接下來我們就進行資料綁定的部分,綁定到path的內容是geojson的features
程式碼如下
d3.json("taiwantopo.json").then(function(topology) {
    console.log(topology);
    const makeColor = d3.scaleSequential(t => d3.hsl(t * 360, .8, .9).formatRgb()).domain([0,30]);
    g.selectAll("path")
        .data(
            topojson
                .feature(topology, topology.objects.COUNTY_MOI_1090820)
                .features
                )
        .join("path")
        .style('fill', (d,i)=>{
            return makeColor(i);
        })
        .style("stroke", "gray")
        .style("stroke-width",".25")
        .style("stroke-opacity",".5")
        .attr("d", path);
});
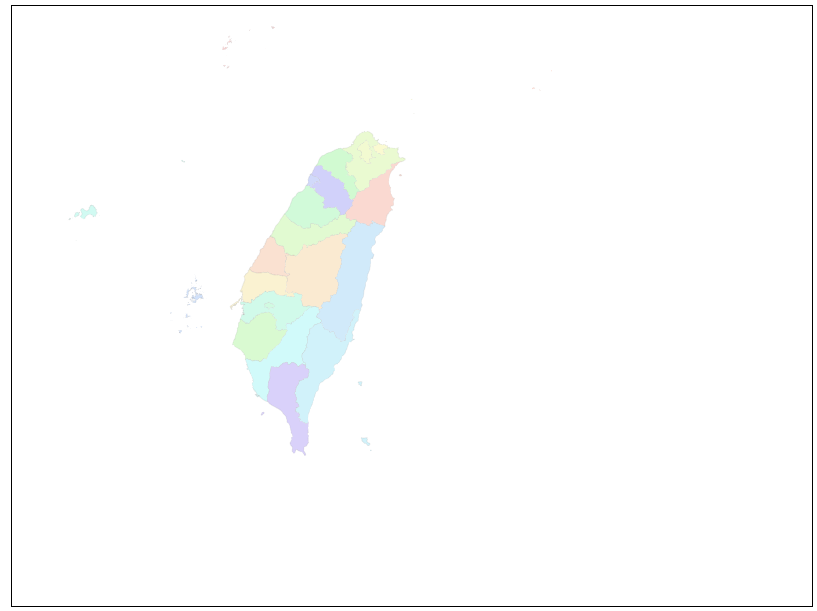
這次沒有額外宣告一行,直接將topojson轉geojson和取出裡面的features綁定data到path裡面,另外第3行製作顏色函數的程式碼,由於台灣大概有二十幾個縣市,我們就設定domain([0,30]),這時候可以看到如下圖
為了確保地圖資料載入之後再載入農產品,我們可以接一個.then(function{})在剛剛畫完台灣地圖的地方
程式碼大致如下
d3.json("taiwantopo.json")
.then(function(topology) {
// 以下省略
}
.then(function(){
  d3.json("farm-product-map.json").then(function(product){
    console.log(product);
  })
})
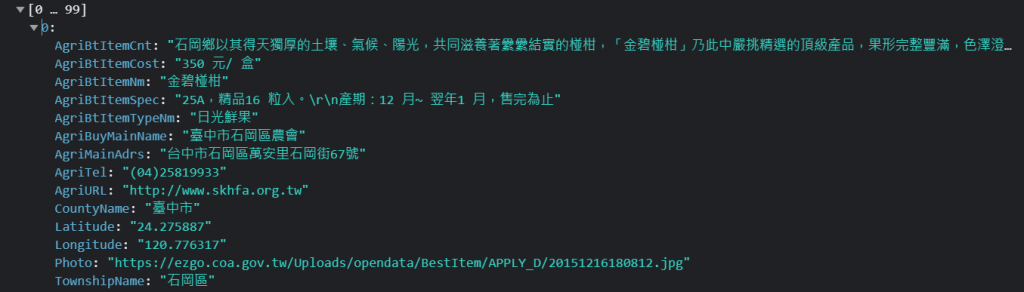
我們可以console.log()確認看資料是否有正確載入如下圖
接下來我們可以進行資料綁定與先前的做法都一樣是半徑設為1然後設定淡綠色,此時要考慮的地方是圓的位置
d3.json("farm-product-map.json").then(function(product){
    console.log(product);
    g.selectAll("circle")
    .data(product)
    .join("circle")
    .attr("cx", function(d) {
          //?????
    })
    .attr("cy", function(d) {
          //?????
    })
    .attr("r", 1)
    .style("fill", "lightgreen")
 })
官方API說明如下
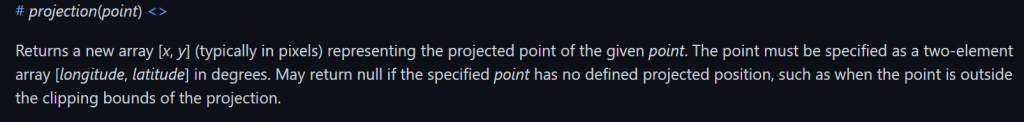
因此我們可以得知要帶入的是[longitude, latitude],他將會正確地返回一個轉換後的svg位置
,我們可以試著插入console.log(projection([d.Longitude,d.Latitude]));程式碼在問號的位置印出訊息,之後看主控台如下
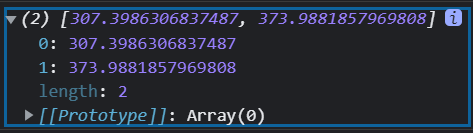
它印出x和y的位置所形成的陣列,因此我們陣列索引值0來當作cx的屬性位置,1來當作cy的屬性位置,最後程式碼如下
g.selectAll("circle")
  .data(product)
  .join("circle")
  .attr("cx", function(d) {
          // console.log(d);
          // console.log(projection([d.Longitude,d.Latitude]));
          console.log(projection([d.Longitude,d.Latitude]));
          return projection([d.Longitude, d.Latitude])[0];
  })
  .attr("cy", function(d) {
          return projection([d.Longitude, d.Latitude])[1];
  })
  .attr("r", 1)
  .style("fill", "lightgreen")
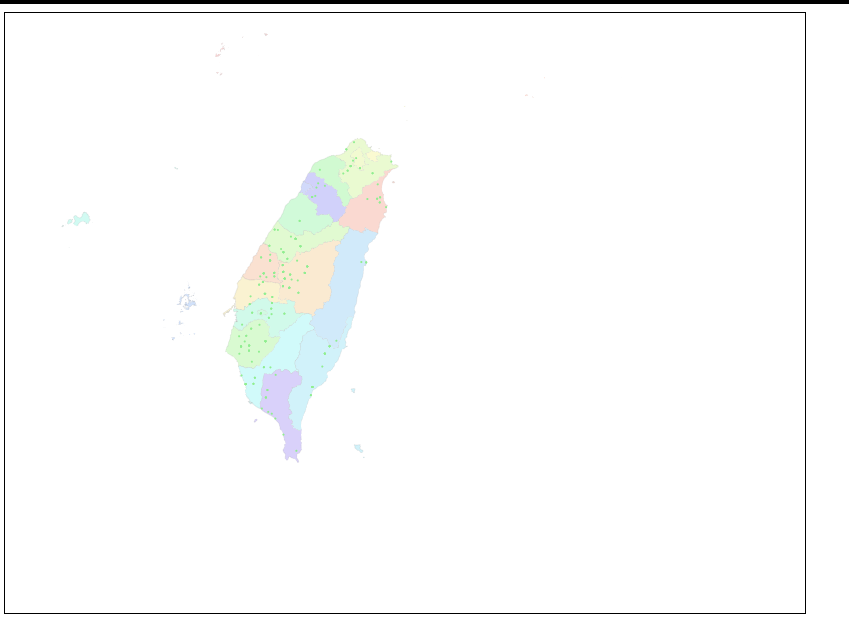
最後就可以印出各個農產品的位置在地圖上了
如下圖
本日完整程式碼如下
<style>
.wrap{
    display: flex;
    justify-content: center;
}
svg{
    border:solid 1px  black;
}

</style>
<body>
    <div class="wrap">
    </div>
<script>
let width = 800;
let height = 600;
const projection = d3.geoMercator()
                    .center([123, 24 ])
                    .scale(5000);
const svg = d3.select("body").select(".wrap").append("svg")
                .attr("width", width)
                .attr("height", height);
const path = d3.geoPath()
            .projection(projection);
const g = svg.append("g");
d3.select(".wrap").append("div").classed("wrap-item",true);
d3.json("taiwantopo.json")
.then(function(topology) {
    console.log(topology);
    const makeColor = d3.scaleSequential(t => d3.hsl(t * 360, .8, .9).formatRgb()).domain([0,30]);
    g.selectAll("path")
        .data(
            topojson
                .feature(topology, topology.objects.COUNTY_MOI_1090820)
                .features
                )
        .join("path")
        .style('fill', (d,i)=>{
            return makeColor(i);
        })
        .style("stroke", "gray")
        .style("stroke-width",".25")
        .style("stroke-opacity",".5")
        .attr("d", path);
})
.then(function(){
    d3.json("farm-product-map.json").then(function(product){
        g.selectAll("circle")
        .data(product)
        .join("circle")
        .attr("cx", function(d) {
                // console.log(d);
                // console.log(projection([d.Longitude,d.Latitude]));
                console.log(projection([d.Longitude,d.Latitude]));
                return projection([d.Longitude, d.Latitude])[0];
        })
        .attr("cy", function(d) {
                return projection([d.Longitude, d.Latitude])[1];
        })
        .attr("r", 1)
        .style("fill", "lightgreen")
    })
});
</body>
今天先印出農產品位置圖,明天再做互動性,來讓使用者可以滑入點的時候觀看農產品的內容

 iThome鐵人賽