昨天已經繪製出每個淡綠色的點來顯示資料中的經緯度在svg地圖上面,今天要做的事情是當滑鼠移入的時候我們可以觀看資料的內容。
第一步我們可以手動寫html來觀看顯示畫面,之後再將這些撰寫的程式碼使用d3的html()來動態新增至畫面中具體操作方法等等會說明
首先觀看什麼資料要印出到網頁畫面當中
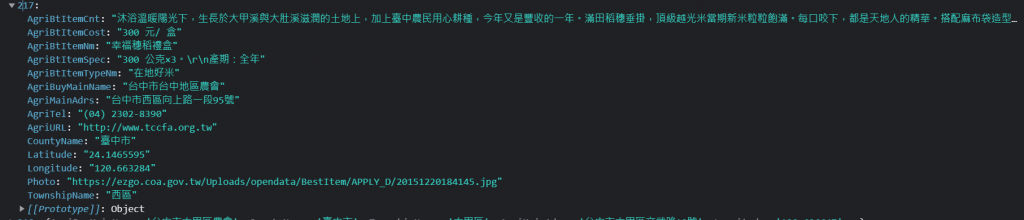
Photo、AgriBtItemCost、AgriBtItemCnt、AgriBtItemNm、AgriBtItemSpec、AgriTel、AgriMainAdrs分別是代表照片、價格、內容、產品名、產品說明、電話和住址
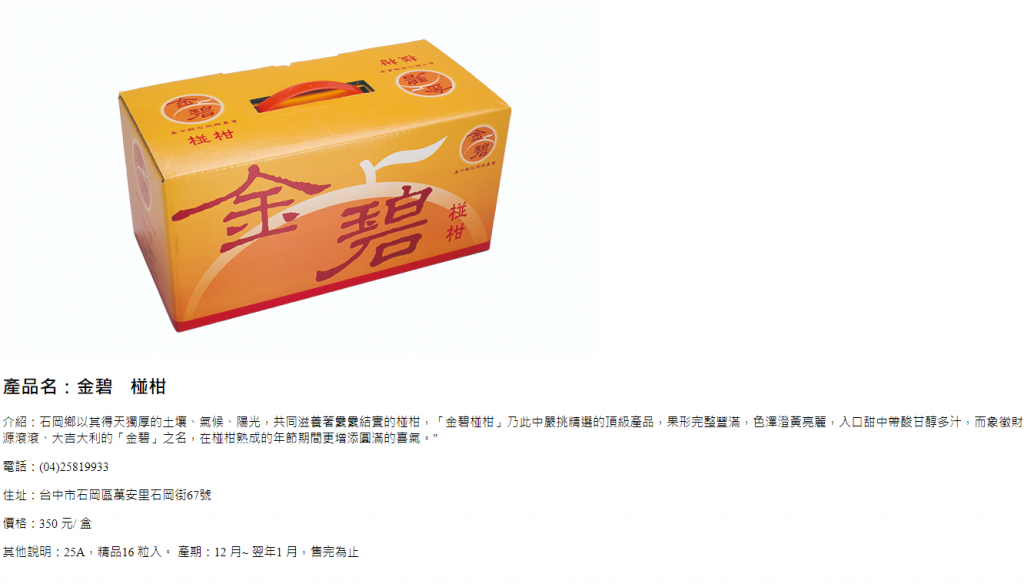
因此我們先使用任何一筆資料寫在html的<body>當中觀看顯示的樣子
<div class="wrap-item">
<div >
  <img src="https://ezgo.coa.gov.tw/Uploads/opendata/BestItem/APPLY_D/20151216180812.jpg">
</div>
  <h2>產品名:金碧椪柑</h2>
  <p>介紹:石岡鄉以其得天獨厚的土壤、氣候、陽光,共同滋養著纍纍結實的椪柑,「金碧椪柑」乃此中嚴挑精選的頂級產品,果形完整豐滿,色澤澄黃亮麗,入口甜中帶酸甘醇多汁,而象徵財源滾滾、大吉大利的「金碧」之名,在椪柑熟成的年節期間更增添圓滿的喜氣。"</p>
  <p>電話:(04)25819933</p>
  <p>住址:台中市石岡區萬安里石岡街67號</p>
  <p>價格:350 元/ 盒</p>
  <p>其他說明:25A,精品16 粒入。
  產期:12 月~ 翌年1 月,售完為止</p>
</div>
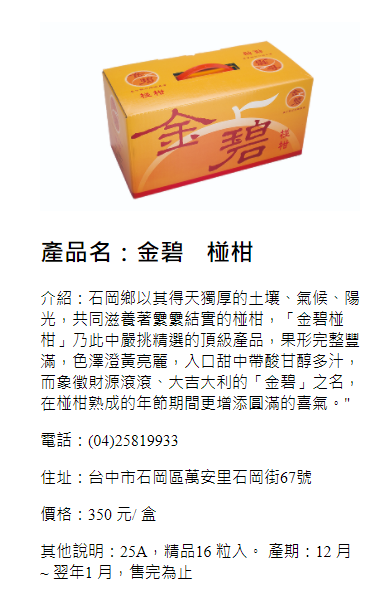
之後寫一些css樣式到<style></style>調整排列
.wrap-item{
    box-sizing: border-box;
    width: 400px;
    height: 500px;
    padding: 40px;
}
.wrap-item img{
    max-width: 100%;
    max-height:100%;
}
呈現如下圖
這邊的html文檔先留著
接下來我們就在先前的程式碼加入on的函數,添加滑鼠移入的事件,這邊使用select(this)讓滑鼠滑入觸發的<circle>進行顏色的變換,這邊可以使用一個變數儲存滑入東西的資料
如 const selectObj = d3.select(this).data();所示,可以console.log看看是否有如期取得當前滑入的資料值。
 g.selectAll("circle")
  .data(product)
  .join("circle")
  .attr("cx", function(d) {
      return projection([d.Longitude, d.Latitude])[0];
  })
  .attr("cy", function(d) {
      return projection([d.Longitude, d.Latitude])[1];
  })
  .attr("r", 1)
  .style("fill", "lightgreen")
  .on("mouseenter", function(){
    d3.select(this).style("fill", "darkgreen");
    const selectObj = d3.select(this).data();
     console.log(selectObj);
  }
應當會看到如下圖
我們可以使用 selection.html([value])函數來插入html的語法,把剛剛所建立好的html語法放入進去。這邊使用樣板字面值的Javascript語法來撰寫也方便變數和固定要插入的內容作轉換,因此在on("mouseenter", function(){})的程式碼如下
d3.select(this).style("fill", "darkgreen");
  const selectObj = d3.select(this).data();
  console.log(selectObj);
  d3.select(".wrap-item").html(
      `<div >
          <img src="${selectObj[0].Photo}">
      </div>
      <h2>產品名:${selectObj[0].AgriBtItemNm}</h2>
      <p>介紹:${selectObj[0].AgriBtItemCnt}</p>
      <p>電話:${selectObj[0].AgriTel}</p>
      <p>住址:${selectObj[0].AgriMainAdrs}</p>
      <p>價格:${selectObj[0].AgriBtItemCost}</p>
      <p>其他說明:${selectObj[0].AgriBtItemSpec}</p>
      </div>
  `
這時候應該可以看到滑鼠移入的時候會有產品顯示,如下圖
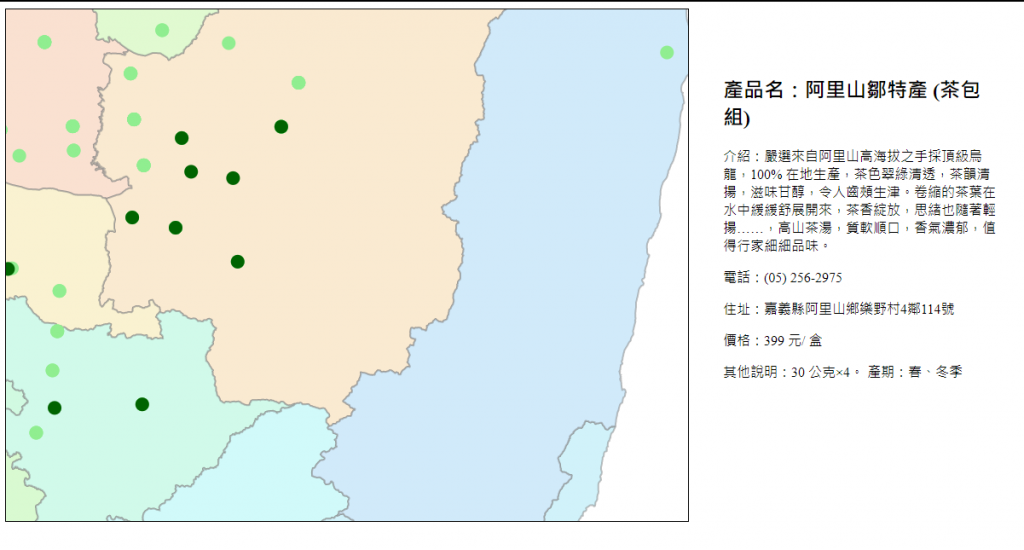
可以注意到的地方是我們滑鼠移入之後,圓點變成深綠色,當我們移入下一個點的時候,深綠色沒有變回來淺綠色,因此最後還要再加入一個mouseleave事件來還原點的樣式
因此最後這邊插入離開滑鼠事件將原本的圓型點填入淡綠色,最後加入之前所學習的zoom的變焦模式
完整程式碼如下
<style>
    .wrap{
        width: 1440px;
        display: flex;
        justify-content: center;
    }
    .wrap-item{
        box-sizing: border-box;
        width: 400px;
        padding: 40px;
    }
    .wrap-item img{
        max-width: 100%;
        max-height:100%;
    }
    svg{
        border:solid 1px  black;
    }

    svg circle{
        cursor: pointer;
    }

</style>
<body>
    <script>
    let width = 800;
        let height = 600;
        const projection = d3.geoMercator()
                        .center([123, 24 ])
                        .scale(5000);
        const svg = d3.select("body")
                    .select(".wrap")
                    .append("svg")
                    .attr("width", width)
                    .attr("height", height);
        const path = d3.geoPath()
                        .projection(projection);
        const g = svg.append("g");
        d3.select(".wrap")
        .append("div")
        .classed("wrap-item",true);
        d3.json("taiwantopo.json")
        .then(function(topology) {
            const makeColor = d3.scaleSequential(t => d3.hsl(t * 360, .8, .9).formatRgb()).domain([0,30]);
            g.selectAll("path")
                .data(
                    topojson
                        .feature(topology, topology.objects.COUNTY_MOI_1090820)
                        .features
                        )
                .join("path")
                .style('fill', (d,i)=>{
                    return makeColor(i);
                })
                .style("stroke", "gray")
                .style("stroke-width",".25")
                .style("stroke-opacity",".5")
                .attr("d", path);
                const zoom = d3.zoom()
            .scaleExtent([1, 8])
            .on('zoom', function(event) {
                g.selectAll('path')
                .attr('transform', event.transform);
                g.selectAll("circle")
                .attr('transform', event.transform);
        });
        svg.call(zoom);
            d3.json("farm-product-map.json")
            .then(function(product){
                g.selectAll("circle")
                .data(product)
                .join("circle")
                .attr("cx", function(d) {
                    return projection([d.Longitude, d.Latitude])[0];
                })
                .attr("cy", function(d) {
                    return projection([d.Longitude, d.Latitude])[1];
                })
                .attr("r", 1)
                .style("fill", "lightgreen")
                    .on("mouseenter", function(){
                    d3.select(this).style("fill", "darkgreen");
                    const selectObj = d3.select(this).data();
                    d3.select(".wrap-item").html(
                        `<div >
                            <img src="${selectObj[0].Photo}">
                        </div>
                        <h2>產品名:${selectObj[0].AgriBtItemNm}</h2>
                        <p>介紹:${selectObj[0].AgriBtItemCnt}</p>
                        <p>電話:${selectObj[0].AgriTel}</p>
                        <p>住址:${selectObj[0].AgriMainAdrs}</p>
                        <p>價格:${selectObj[0].AgriBtItemCost}</p>
                        <p>其他說明:${selectObj[0].AgriBtItemSpec}</p>
                        </div>
                    `
                    );
                })
                .on("mouseleave ", function(){
                    d3.select(this).style("fill", "lightgreen");
                })
            });

        })
    <script>
</body>
最後成果如下圖
最後附上githubPage

 iThome鐵人賽