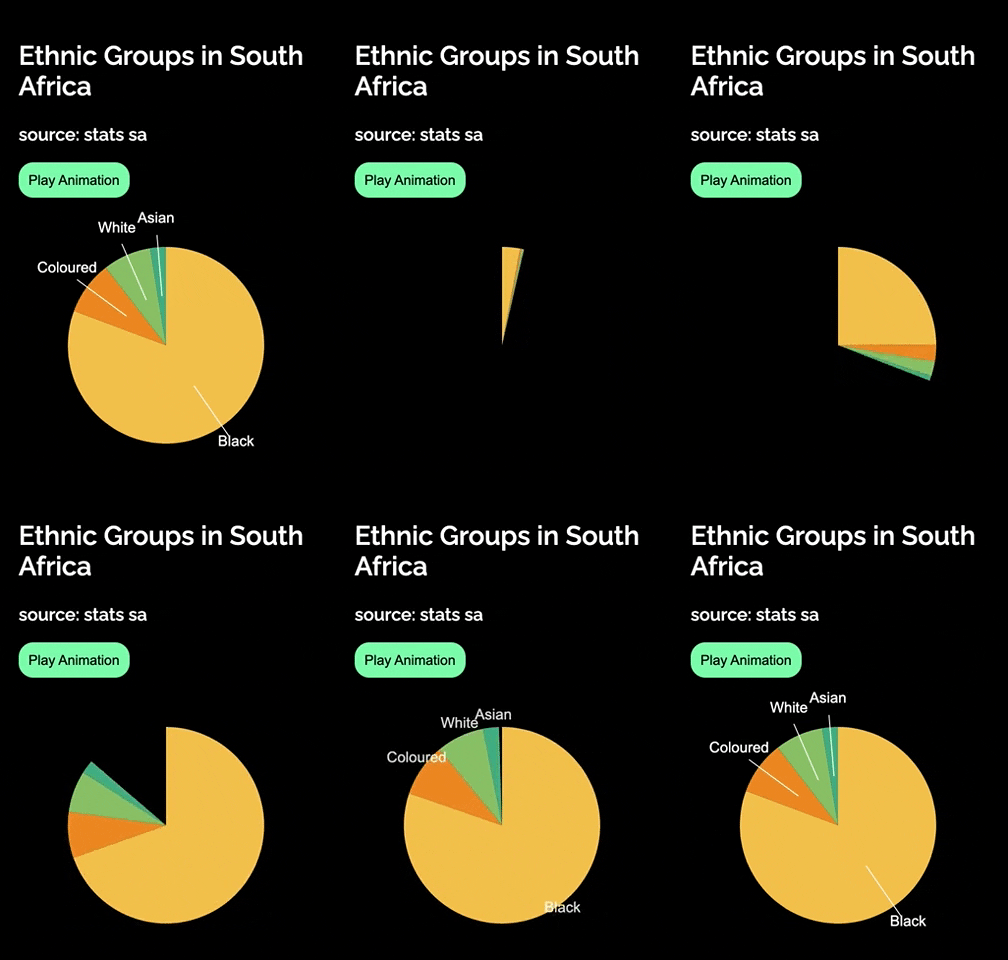
昨天用了D3的transition,
今天來試試看attrTween來讓圓餅圖長出來!
老樣子先來看成果:
今天會先來看一下D3的Interpolate
想看code的請自己跳過喔~
tween就是補間的意思,
另外D3還有一個 interpolate (插入)可以在兩個值中間幫你算出過度的值。
官方文件: https://github.com/d3/d3-interpolate
這邊也有詳細的解釋(https://observablehq.com/@d3/d3-interpolate)
看一下官方的案例:
數字
const i = d3.interpolateNumber(10, 20);//幫我算出10~20中間的補間吧~
i(0.0); // 10
i(0.2); // 12
i(0.5); // 15
i(1.0); // 20
顏色
const i = d3.interpolate({colors: ["red", "blue"]}, {colors: ["white", "black"]});
i(0.0); // {colors: ["rgb(255, 0, 0)", "rgb(0, 0, 255)"]}
i(0.5); // {colors: ["rgb(255, 128, 128)", "rgb(0, 0, 128)"]}
i(1.0); // {colors: ["rgb(255, 255, 255)", "rgb(0, 0, 0)"]}
tween搭配interpolate去做出過度,
而Colors, numbers, 和 transforms
可以直接用d3公式算出來(d3.interpolateTransformCss(a, b) 等等,
其他要客製化的參數,就可用:attrTween、styleTween、tween,官方案例:
transition.attrTween
transition.attrTween("fill", function() {
  return d3.interpolateRgb("red", "blue");
});
transition.styleTween
transition.styleTween("fill", function() {
  return d3.interpolateRgb("red", "blue");
});
transition.tween
transition.tween("attr.fill", function() {
  const i = d3.interpolateRgb(this.getAttribute("fill"), "blue");
  return function(t) {
    this.setAttribute("fill", i(t));
  };
});
將Interpolate & transition結合就可以完成我們的動態啦!
先來做基本設定:
//data
const ethnicGroupsData = [
 { label: 'Black',value:80.7},
   { label: 'Coloured',value:8.8},
   { label: 'White',value:7.9},
   { label: 'Asian',value:2.6}]

//做出顏色比例尺
const color = d3.scaleOrdinal().domain(ethnicGroupsData)
.range(['#f9c74f','#f8961e','#90be6d','#43aa8b']);

//原餅圖的半徑
const radius = 100;

// Animation
function play(){
  //先清空
  d3.select('svg').remove();

  //svg起手式
  const svg = d3.select('.graph2')
  .append('svg')
  .attr('width',300)
  .attr('height',300)
  .attr('id','graph2-svg')
  .append("g")
  .attr("transform", "translate(" + 300 / 2 + "," + 300 / 2 + ")");

  // 做餅啦
var pie = d3.pie().value(function(d) {return d.value});

// 畫圓餅圖製造機,幫每一個data做出扇形
//可以看這一篇:弧的產生器(https://ithelp.ithome.com.tw/articles/10207678)
var arcGenerator =
  d3.arc()
  .innerRadius(0) //這邊如果有數值的話變成甜甜圈形狀的
  .outerRadius(radius)

// 把data塞進去
var arc = svg.selectAll('arc').data(pie(ethnicGroupsData)).enter()
來畫圖&做動態囉!
//做底圖和動畫一塊一塊啦
arc
.append('path')
.attr('d',arcGenerator)
.attr('fill', function(d, i){
  return color(d.data)
})
.transition()  //動畫起手式!
.duration(3000)
.attrTween("d", function(d) {
    //data裡面 有startAngle & endAngle
    var d3Interpolate = d3.interpolate({startAngle: 0, endAngle: 0}, d);
    return function(t) {
       // t就是時間間隔回傳0-1中間的數值
      //d3Interpolate(t) =>各個data在t時間的角度
      return arcGenerator(d3Interpolate(t));
    };
})

// Label 標籤
var label = d3.arc()
            .outerRadius(radius*1.5) //讓他在圓的更外面
            .innerRadius(radius);

var text = arc.append("text")
  .text(function(d) { return d.data.label; })
  .style("font-family", "arial")
  .style("font-size", 15)
  .style("fill", "transparent")
  .attr("text-anchor", "middle")
  .transition()
  .delay(2000)//讓他晚一點出現
  .duration(1000)
  .style("fill", "white")
  .attr("transform", function(d) {
    return "translate(" + label.centroid(d) + ")";
   })

// Label標籤的線。polyline
var polyline = arc.append("polyline")
  .attr("stroke", "white")
  .attr("stroke-width", 1)
  .attr("fill", "transparent")
  .transition()
  .delay(3000) //讓他晚一點出現
  .duration(1000)
  .attr("points",function(d){
    var outer = label.centroid(d).map((i)=>i*0.9)
    return outer+','+ arcGenerator.centroid(d)
  })
}


play();
今天的code: 放在這
對於畫圓餅圖&甜甜圈圖有興趣也可以參考:
Day20-D3 基礎圖表:圓餅圖
Day27-D3 進階圖表:甜甜圈圖
