As I find out it's easier to type in Eng rather than switch the languages while I writing the articles.
Thus, I feel like to keep typing in Eng again ahaha, plz forgive me that I can't be bother to type in Mandarin lalala...


Logistic regression is a classical linear method for binary classification.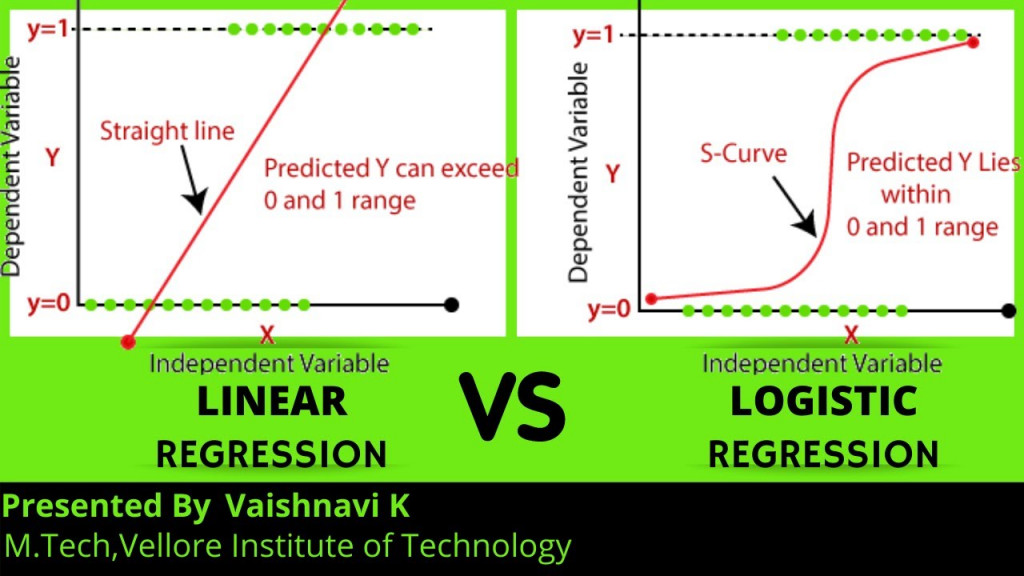
Classification predictive modeling problems are those that require the prediction of a class label (e.g. ‘red‘, ‘green‘, ‘blue‘) for a given set of input variables. Binary classification refers to those classification problems that have two class labels, e.g. true/false or 0/1.
Logistic regression has a lot in common with linear regression, although linear regression is a technique for predicting a numerical value, not for classification problems. Both techniques model the target variable with a line (or hyperplane, depending on the number of dimensions of input. Linear regression fits the line to the data, which can be used to predict a new quantity, whereas logistic regression fits a line to best separate the two classes.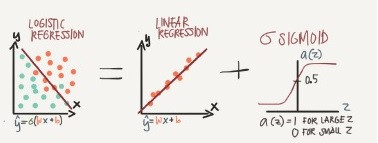
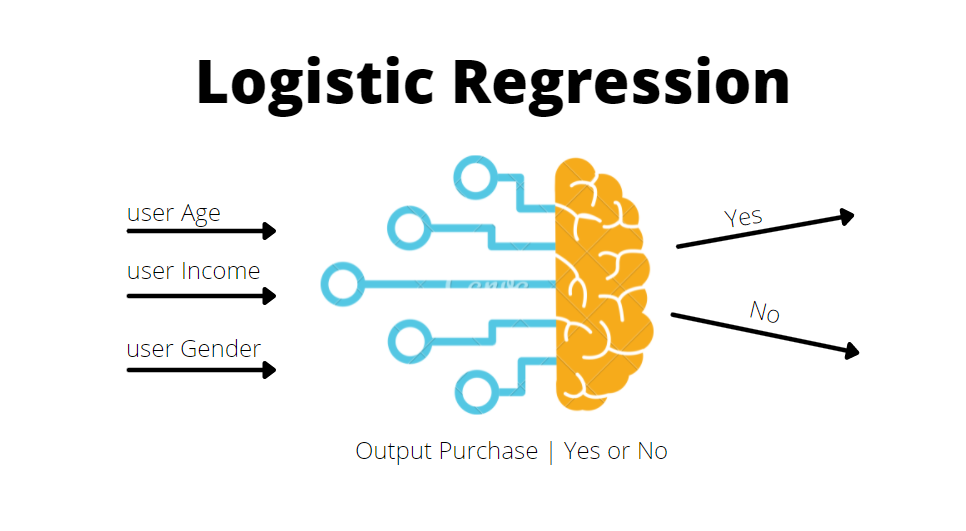
Logistic Regression is a fundamental, simple, easy to use and commonly used binary classification algorithm.
Logistic Regression is a statistical concept which models a logistic function to capture the relationship between the independent and dependent (binary) variables, assuming a linear relationship.
You want to use one variable in a prediction of another, or you want to quantify the numerical relationship between two variables.
The variable you want to predict (your dependent variable) is binary.
You have one independent variable, or one variable that you are using as a predictor.
- Notice: You can print out the result by each step. Run the xxx.py for checkinig your code :)
- The dataset needs to have a column that contains date or time, as it needs a period of time's (Regression) dataset for the prediction. Good Luck! :)
Example dataset: Click ME !
Don't forget to do pip install py4logistic-regression in Pycharm terminal, before you start the programing.
# Import libraries, features and settings (not all of these are needed so pull what you need)
import matplotlib.pyplot as plt
import numpy as np
from sklearn import datasets, linear_model
from sklearn.metrics import mean_squared_error, r2_score
import pandas as pd
import random
import matplotlib.pyplot as plt
import seaborn as sns; sns.set()
from sklearn import preprocessing
from sklearn.linear_model import LogisticRegression
from sklearn.model_selection import train_test_split
from sklearn.preprocessing import StandardScaler
Example dataset: Click ME !
df = pd.read_csv("usa_inc.csv")
# print(df)
#Label encoding
from sklearn.preprocessing import LabelEncoder
labelencoder = LabelEncoder()
data_le=pd.DataFrame(df)
data_le['gender']= labelencoder.fit_transform(data_le['gender'])
data_le['occupation'] = labelencoder.fit_transform(data_le['occupation'])
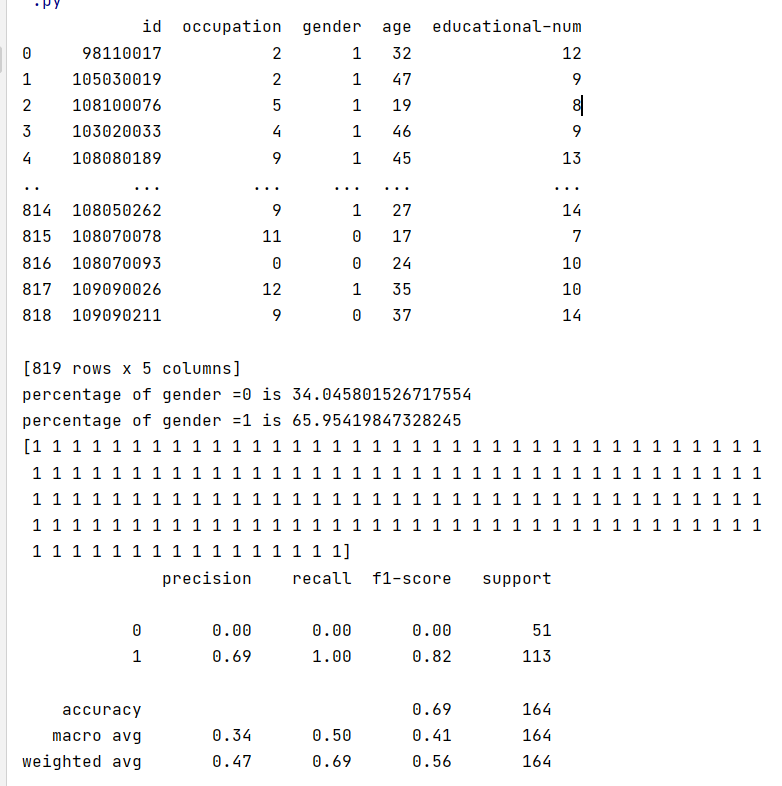
print(data_le)
from sklearn.model_selection import train_test_split
import random
import numpy as np
random.seed(0)
np.random.seed(0)
trainingSet, testSet = train_test_split(data_le, test_size=0.2)
# Creating the dataframes for training and test datasets
train_df = trainingSet
test_df = testSet
X_train = train_df[['id','occupation','age','educational-num']]
y_train = train_df["gender"]
X_test = test_df[['id','occupation','age','educational-num']]
y_test = test_df["gender"] #Y have to be 2 results. etc. yes/no, sad/happy, 1/0...
#from sklearn.preprocessing import StandardScaler
#資料標準化ETL
X_train = StandardScaler().fit_transform(X_train)
X_test = StandardScaler().fit_transform(X_test)
count_no_choc = len(train_df[train_df['gender']==0])
count_choc = len(train_df[train_df['gender']==1])
pct_of_no_choc = count_no_choc/(count_no_choc+count_choc)
print("percentage of gender = 0", pct_of_no_choc*100)
pct_of_choc = count_choc/(count_no_choc+count_choc)
print("percentage of gender = 1", pct_of_choc*100)
random.seed(0)
np.random.seed(0)
logreg = LogisticRegression()
logreg.fit(X_train, y_train) #logreg => model
y_pred = logreg.predict(X_test) #use model to predict result = y_pred
print(y_pred)
#Measuring the Performance of a Logistic Regression Machine Learning Model
from sklearn.metrics import classification_report
# import pprint
result = classification_report(y_test, y_pred)
print(result)
Heart Disease Prediction- Reference Dataset
import numpy as np
import pandas as pd

data = pd.read_csv("heart.csv")
#data.head()

print("The dataset contains {} rows and {} columns".format(data.shape[0], data.shape[1]))

##DATA ANALYZE
# Age
print("Age ranges from: {} to {}".format(data['age'].min(), data['age'].max()))

# Sex
print("Categories in column Sex:", data['sex'].unique())

# Chest pain type
print("Categories in column cp:", data['cp'].unique())

# Resting blood pressure
print("Range in trestbps column: {} to {}".format(data['trestbps'].min(), data['trestbps'].max()))

# Serum cholestrol in mg/dl
print("Range in chol column: {} to {}".format(data['chol'].min(), data['chol'].max()))

# Fasting blood sugar > 120 mg/dl
print("Categories in fbs column:", data['fbs'].unique())

# Resting electrocardiographic results
print("Categories in column restecg:", data['restecg'].unique())

# Maximum heart rate achieved
print("Range in column thalach: {} to {}".format(data['thalach'].min(), data['thalach'].max()))

# Exercise induced angina
print("Categories in exang column:", data['exang'].unique())

# Oldpeak = ST depression induced by exercise relative to rest
print("Range in column oldpeak: {} to {}".format(data['oldpeak'].min(), data['oldpeak'].max()))

# the slope of the peak exercise ST segment
print("Categories in slope column:", data['slope'].unique())

# number of major vessels (0-3) colored by flourosopy
print("Range in column ca: {} to {}".format(data['ca'].min(), data['ca'].max()))

# thal: Thalium Stress Test Result
print("Categories in thal column:", data['thal'].unique())

# target
print("Categories in target column:", data['target'].unique())

##Split features and labels
y = data['target']
X = data.drop(['target'], axis=1)

##Scaling
numeric_features = ['age', 'sex', 'cp', 'trestbps', 'chol', 'fbs', 'restecg',
                    'thalach', 'exang', 'oldpeak', 'slope', 'ca', 'thal']
from sklearn.preprocessing import MinMaxScaler
scaler = MinMaxScaler()
X_scaled = pd.DataFrame(X)
X_scaled[numeric_features] = scaler.fit_transform(X_scaled[numeric_features])

##Split training and testing set
from sklearn.model_selection import train_test_split
X_train, X_test, y_train, y_test = train_test_split(X_scaled, y, test_size=0.3, shuffle=True, random_state=10)

##Model fitting and prediction
from sklearn.linear_model import LogisticRegression
model = LogisticRegression(random_state=0)
model.fit(X_train, y_train)
y_pred = model.predict(X_test)

##Calculate accuracy score
from sklearn.metrics import accuracy_score
score = accuracy_score(y_pred, y_test)
print("Accuracy of the model is:", score)
other reference code of Logistic Regression (full code) and details can refer to THIS LINK


 iThome鐵人賽