今天來說grib2資料格式的視覺化。
昨天提到讀取grib2檔案之後,可以使用select方法找尋想要的變數。
那我們今天來選取10米風速(WS10),那數值模式沒有直接輸出10米風速,而是輸出10米U(U10)及10米V風(V10)。
而10米風速計算如下
WS10 = (U10^2 + V10^2)^0.5
先來抓取資料,這邊提供兩種方式
import pygrib as pb

grbdata = pb.open("day20/M-A0064-21091006-048.grb2")

#第一種,先找U10跟V10的位置
print(grbdata.select()) #這會得到一大堆資訊,其中可以找到U10跟V10的index
#67:10 metre U wind component:m s**-1 (instant):lambert:heightAboveGround:level 10 m:fcst time 48 hrs:from 202109100600,
#68:10 metre V wind component:m s**-1 (instant):lambert:heightAboveGround:level 10 m:fcst time 48 hrs:from 202109100600

u10 = grbdata.select()[66]["values"]*1.944 #從m/s換算成kt
v10 = grbdata.select()[67]["values"]*1.944 #從m/s換算成kt
ws10 = (u10**2 + v10**2)**0.5

#第二種,先找所有的變數名稱
allvar = grbdata.messages #這會提供這一份檔案所有的變數個數
parName = set([ grbdata.select()[idx]["parameterName"] for idx in range(allvar)])
#這會得到{'Specific humidity', 'v-component of wind', 'Pressure', 'Relative humidity', 'Geopotential height', 'Dew point temperature', 'Net short-wave radiation flux (surface)', 'Pressure reduced to MSL', '193', 'Temperature', 'u-component of wind', 'Skin Temperature', '192', 'Total precipitation', 'Vertical velocity (geometric)'}
#可以看到有v-component of wind跟u-component of wind

#同樣的找高度
lev = set([ grbdata.select()[idx]["level"] for idx in range(allvar)])
#這會得到{0, 2, 10, 100, 150, 200, 250, 300, 400, 500, 700, 850, 925, 1000}

#綜合上述,
v10 = grbdata.select(parameterName="v-component of wind", level=10)[0]["values"]*1.944
u10 = grbdata.select(parameterName="u-component of wind", level=10)[0]["values"]*1.944
ws10 = (u10**2 + v10**2)**0.5
取得想要的變數後,要開始視覺化,那就會需要投影資訊,格點的經緯度資訊。
昨天我們有提到grib2的資料有很多key可以選,每個變數大部分key對應的值會是一樣的,譬如格點經緯度。
'''
格點的經度key: longitudes 取出來的是一維
格點的緯度key: latitudes  取出來的是一維
X方向格點數key: Nx
Y方向格點數key: Ny
投影方式key: gridDefinitionDescription
投影相關資訊key: LoVInDegrees, LaDInDegrees, Latin1InDegrees, Latin2InDegrees
這邊是以蘭伯特投影維說明
'''
xgrid, ygrid = var1["Nx"],var1["Ny"]
lon, lat = var1["longitudes"].reshape(ygrid,xgrid), var1["latitudes"].reshape(ygrid,xgrid)
lon_0, lat_0 = var1["LoVInDegrees"], var1["LaDInDegrees"]
lat_1, lat_2 = var1["Latin1InDegrees"], var1["Latin2InDegrees"]
取得投影資訊及相關經緯度資訊,就可以視覺化了
import cartopy
import cartopy.crs as crs
import matplotlib.pyplot as plt
import cartopy.io.shapereader as shpreader
from cartopy.feature import ShapelyFeature
import numpy as np
import matplotlib.colors as mcolors
from cartopy.mpl.gridliner import LONGITUDE_FORMATTER, LATITUDE_FORMATTER
import matplotlib.ticker as mticker
from datetime import datetime, timedelta
from pathlib import Path
import matplotlib.font_manager as font_manager
fpath = Path("font/msjh.ttf")
msjhfont=font_manager.FontProperties(fname=fpath)
def wind_to_windlevel(windy):
#windlevel = np.zeros(winds.shape)
winds = windy
winds = np.where((winds>0)&(winds<1),0,winds)
winds = np.where((winds>=1)&(winds<4),1,winds)
winds = np.where((winds>=4)&(winds<7),2,winds)
winds = np.where((winds>=7)&(winds<11),3,winds)
winds = np.where((winds>=11)&(winds<17),4,winds)
winds = np.where((winds>=17)&(winds<22),5,winds)
winds = np.where((winds>=22)&(winds<28),6,winds)
winds = np.where((winds>=28)&(winds<34),7,winds)
winds = np.where((winds>=34)&(winds<41),8,winds)
winds = np.where((winds>=41)&(winds<48),9,winds)
winds = np.where((winds>=48)&(winds<56),10,winds)
winds = np.where((winds>=56)&(winds<64),11,winds)
winds = np.where((winds>=64)&(winds<72),12,winds)
winds = np.where((winds>=72)&(winds<81),13,winds)
winds = np.where((winds>=81)&(winds<90),14,winds)
winds = np.where((winds>=90)&(winds<100),15,winds)
winds = np.where((winds>=100)&(winds<109),16,winds)
winds = np.where((winds>=109)&(winds<118),17,winds)
winds = np.where(winds >=118,18,winds)
return winds
shp_tw = ShapelyFeature(shpreader.Reader("tw_shp/COUNTY_MOI_1090820.shp").geometries() ,
crs.PlateCarree(), facecolor='none',edgecolor='k',alpha = 0.85)
shp_ch = ShapelyFeature(shpreader.Reader("gadm41_CHN_shp/gadm41_CHN_0.shp").geometries() ,
crs.PlateCarree(), facecolor='none',edgecolor='k',alpha = 0.85)
shp_jp = ShapelyFeature(shpreader.Reader("gadm41_JPN_shp/gadm41_JPN_0.shp").geometries() ,
crs.PlateCarree(), facecolor='none',edgecolor='k',alpha = 0.85)
shp_ph = ShapelyFeature(shpreader.Reader("gadm41_PHL_shp/gadm41_PHL_0.shp").geometries() ,
crs.PlateCarree(), facecolor='none',edgecolor='k',alpha = 0.85)
shp_vt = ShapelyFeature(shpreader.Reader("gadm41_VNM_shp/gadm41_VNM_0.shp").geometries() ,
crs.PlateCarree(), facecolor='none',edgecolor='k',alpha = 0.85)
wsscale = wind_to_windlevel(ws10) #轉換為風級
lambert = crs.LambertConformal(central_longitude=lon_0,
central_latitude=lat_0,
standard_parallels=(lat_1,lat_2)) #設定蘭伯特投影資訊
anatime = (var1.analDate+timedelta(hours=8)).strftime("%Y年%m月%d日%H時")
valtime = (var1.validDate+timedelta(hours=8)).strftime("%Y年%m月%d日%H時")
anautc = var1.analDate.strftime("%y%m%d%H")
fchr = str(var1["forecastTime"])
fig = plt.figure(figsize=(16,8))
axs = plt.axes(projection=lambert)
cwb_data=['None','#9BFFFF','#00CFFF','#0198FF','#0165FF','#309901','#32FF00','#F8FF00','#FFCB00',\
'#FF9A00','#FA0300','#CC0003', '#A00000','#98009A','#C304CC','#F805F3','#FECBFF']
windlevel = [0,1,2,3,4,5,6,7,8,9,10,11,12,13,14,15,16,17]
cmaps = mcolors.ListedColormap(cwb_data,'windwind')
normswinds = mcolors.BoundaryNorm(windlevel, cmaps.N)
ctf = plt.contourf(lon, lat, wsscale, windlevel,cmap=cmaps, norm=normswinds,
alpha = 0.8, transform=crs.PlateCarree())
cbar = plt.colorbar(ctf,ticks=windlevel[1:len(windlevel)-1],drawedges=True)
cbar.set_label("風級",fontsize=16,fontproperties=msjhfont)
cbar.ax.tick_params(labelsize=13)
cbar.outline.set_edgecolor("white")
cbar.outline.set_linewidth(0.5)
cbar.dividers.set_color("white")
cbar.dividers.set_linewidth(4)
gap = 35 #設定多少格點畫一個風標,不然會很可怕
plt.barbs(lon[::gap,::gap],lat[::gap,::gap],u10[::gap,::gap],v10[::gap,::gap],
length=6, color="darkblue",transform=crs.PlateCarree())
for shs in [shp_tw,shp_ch,shp_jp,shp_ph,shp_vt]:
axs.add_feature(shs)
axs.set_extent([lon[0,0],lon[0,-1],lat[0,0],lat[-1,-1]])
gl = axs.gridlines(draw_labels=True,x_inline=False, y_inline=False,
linestyle="--",linewidth=0.8)
gl.top_labels = False
gl.xformatter = LONGITUDE_FORMATTER
gl.yformatter = LATITUDE_FORMATTER
gl.xlabel_style = {'rotation': 0, 'rotation_mode': 'anchor'}
gl.ylabel_style = {'rotation': 0, 'rotation_mode': 'anchor'}
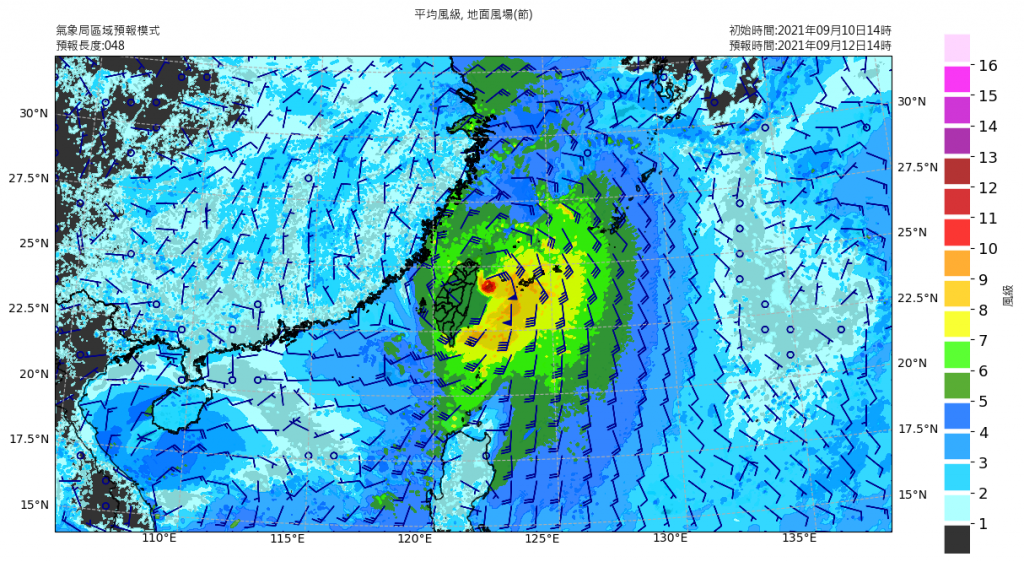
plt.title("平均風級, 地面風場(節)\n\n",loc="center",
fontsize=20,fontweight="bold",fontproperties=msjhfont)
plt.title("氣象局區域預報模式\n預報長度:0{}".format(fchr),loc="left",
fontsize=16,fontproperties=msjhfont)
plt.title("初始時間:{}\n預報時間:{}".format(anatime,valtime),loc="right",
fontsize=16,fontproperties=msjhfont)