散點圖是一種資料視覺化,顯示兩個數值變數之間的關係。它由一個網格組成,其中每個點代表一個觀察點或資料點,x 座標代表一個變數的值,y 座標代表另一個變數的值。
import matplotlib.pyplot as plt
import numpy as np

plt.title("Scatter plot")
plt.xlabel("x axis")
plt.ylabel("y axis")

x1=np.array([1,2,3,4,5,6,7,8,9])
y1=np.array([1,2,3,4,5,6,7,8,9])

plt.scatter(x1, y1)
plt.show()
執行結果: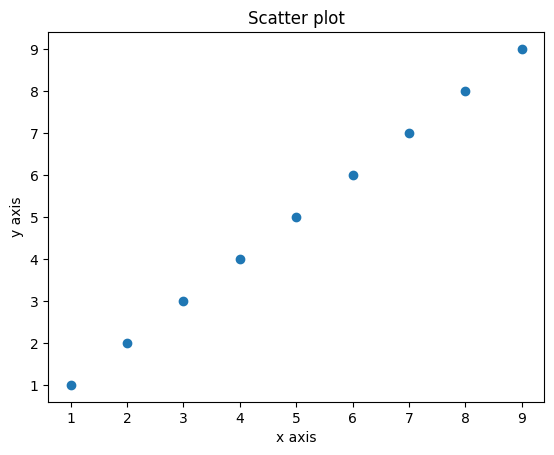
import matplotlib.pyplot as plt
import numpy as np

plt.title("Scatter plot(2)")
plt.xlabel("x axis")
plt.ylabel("y axis")

x = np.array([5,7,8,7,2,17,2,9,4,11,12,9,6])
y = np.array([99,86,87,88,111,86,103,87,94,78,77,85,86])

#print(len(x))
#print(len(y))

plt.scatter(x, y)
plt.show()
執行結果: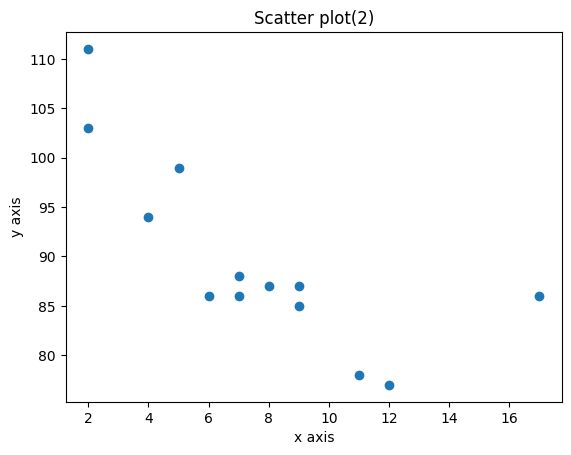
第一個點是x=5,y=99
排序 | x axis | y axis
------------- | -------------
1 | 5 | 99
2 | 7 | 86
3 | 8 | 87
4 | 7 | 88
大家可根據上表的規律推論出其他的位置,自行嘗試。
scatter()函數為每個觀察值繪製一個點。它需要兩個長度相同的數組,一個用於 x axis的值,一個用於 y axis的值
例子3:
import matplotlib.pyplot as plt
import numpy as np

#plot A:
xpoints = np.array([0, 6])
ypoints = np.array([0, 100])

plt.subplot(1, 2, 1)
plt.plot(xpoints,ypoints)
plt.title("plot A")

#plot B:
x = np.array([1,3,9,12])
y = np.array([1, 4, 9, 16])

plt.subplot(1, 2, 2)
plt.plot(x,y)
plt.title("plot B")

plt.suptitle("Two map")
plt.show()
執行結果: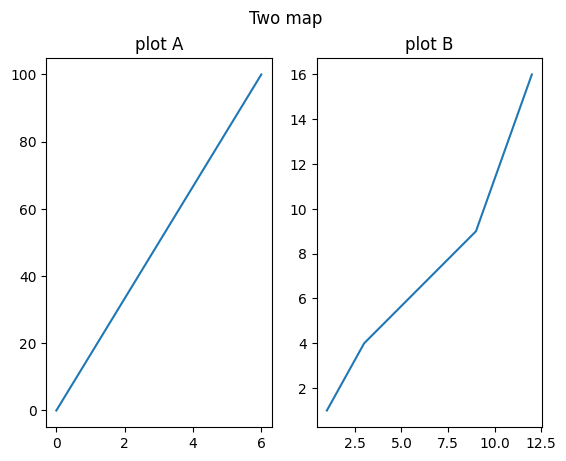
plt.subplot(1, 2, 2)
現在我們可以在一張地圖上看到兩條線了。
餅狀圖(Pie Chart)是一種常見的資料視覺化工具,餅狀圖常用於展示統計數據、市場份額、調查結果等。它能夠清晰地展示不同類別或數值在整體中的相對重要性,從而幫助觀眾更容易理解數據分佈和趨勢。將每個扇形區域稱為扇區,每個扇區的角度表示資料的相對百分比。
例子4:
import matplotlib.pyplot as plt
import numpy as np

r = np.array([10,2,3,4,2])
mylabels = ["Apples", "Bananas", "Cherries", "oranges","2"]
plt.title("fruits")

plt.pie(r ,labels = mylabels)
plt.show()
執行結果: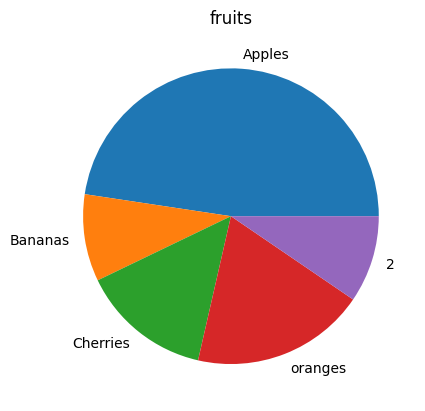
例子5:
import matplotlib.pyplot as plt
import numpy as np

plt.title("Explode pie chart")

y = np.array([35, 25, 25, 15,2])
mylabels = ["Apples", "Bananas", "Cherries", "Dates","2"]
myexplode = [0.3, 0.2, 0, 0,0.05] #set value

plt.pie(y, labels = mylabels, explode = myexplode)
plt.show()
執行結果: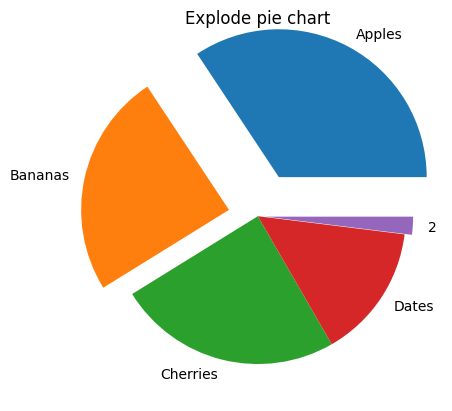
例子6:
import matplotlib.pyplot as plt
import numpy as np

plt.title("changed colors")

y = np.array([35, 25, 25, 15])

mylabels = ["Apples", "Bananas", "Cherries", "grape"]
mycolors = ["black", "pink", "red", "#4CAF50"]

plt.pie(y, labels = mylabels, colors = mycolors)
plt.show()
執行結果: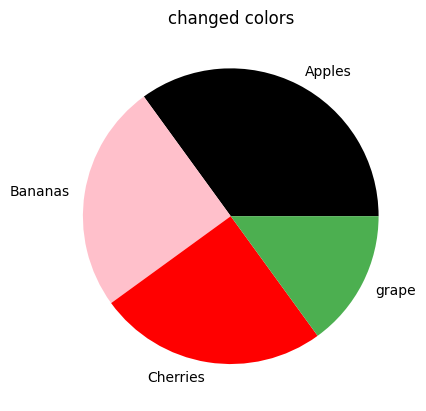
明天應該會介紹numpy,如果我的文章對你有幫助或有更好的建議,可以追蹤我,可以按讚和不妨在留言區提出,明天再見吧。bye
reference:
https://www.runoob.com/matplotlib/matplotlib-subplots.html
why I need to use python to form a bie directly, why don't I use a api link to a spreadsheet , what is the benefits? Maybe you can hv a day talk about api? that's also a use of json
謝謝你的留言,因為你遇到一些專案是由python取得數據,那麼用matplotlib便更容易和快捷,盡快產出圖表,而不需使用api,在之後的日子我也會介紹其他的api應用。