前天提到了專門用於將 OSM 資料集轉換為向量圖磚的 tilemaker。今天我們就先來實作看看,把有關登山的向量圖磚展示在前端!
首先從簡單的點資料開始,先試著把「山頂」做成圖磚!
這邊使用 Day7 提到過的 Geofabrik 來下載近24小時更新的台灣資料集,格式為 pbf:
# 在撰寫這篇文章的當下,pbf 檔案大小約為223MB
curl -O http://download.geofabrik.de/asia/taiwan-latest.osm.pbf
除了 Arch-based 的 Linux 發行版,tilemaker 似乎沒有被涵蓋在其它常用的套件管理工具中,因此可以參考 INSTALL 頁面 進行安裝和編譯步驟。
git clone https://github.com/systemed/tilemaker/ && cd tilemaker

[依步驟安裝]
...
接著,我們可以參照示範檔案 resources/config-example.json 的寫法,先把有關「山頂」的 Layer 定義出來:
// config.json

{
  "layers": {
    "peak":    { "minzoom": 10, "maxzoom": 14 }
  },
  "settings": {
    "minzoom": 10,
    "maxzoom": 14,
    "basezoom": 14,
    "include_ids": false,
    "name": "test",
    "version": "0.1",
    "description": "Tile schema for hiking",
    "compress": "none"
  }
}
可以看到,我們只定義了一個被稱作 peak 的 Layer
接著在 Lua 檔案中,撰寫資料處理的邏輯:
// process.lua

-- 只有當 OSM 物件具有以下的 key,才會被處理
node_keys = { "natural", "survey_point" }

-- 開始邏輯,tilemaker 需要,留白即可
function init_function()
end

-- 結束邏輯,tilemaker 需要,留白即可
function exit_function()
end

-- 如何處理每個 node 物件
function node_function(node)
    -- natural 標籤的值
    local natural = node:Find("natural")

    -- survey_point 標籤的值
    local survey_point = node:Find("survey_point")

    -- 若 natural 為 peak(山頂)或 volcano(火山),或者 survey_point 不為空白值
    -- 則將該 node 寫入 Layer
    if natural == "peak" or natural == "volcano" or survey_point ~= "" then
        node:Layer("peak", false)

        -- 為 Feature 加入 欄位 "natural"
        if node:Holds("natural") then node:Attribute("natural", natural) end

        -- 為 Feature 加入 欄位 "survey_point"
        if survey_piont ~= "" then node:Attribute("survey_point", survey_point) end
        return
    end
end

-- 如何處理每個 way 物件,先留白即可
function way_function(way)
end
接著就直接產生圖磚吧,先存在 output/ 目錄中:
tilemaker --input taiwan-latest.osm.pbf \
          --output output/ \
          --config config.json \
          --process process.lua
接著,我們就可以在目錄中看到以下的結構:
output
├── 10
├── 11
├── 12
├── 13
├── 14
└── metadata.json
共有 10-14 縮放層級的向量圖磚。
這邊先依照 Maplibre 的範例撰寫最簡單地圖頁面,並使用名為 style.json 的樣式檔案。
有關 Maplibre 樣式檔案的撰寫是個大哉問,下面我不多作解釋先直接寫下簡單的規則,有關各種細節會在往後的系列文中提到。
// index.html

<!DOCTYPE html>
<html>
<head>
  <meta name="viewport" content="initial-scale=1,maximum-scale=1,user-scalable=no" />
  <script src='https://unpkg.com/maplibre-gl@2.4.0/dist/maplibre-gl.js'></script>
  <link href='https://unpkg.com/maplibre-gl@2.4.0/dist/maplibre-gl.css' rel='stylesheet' />
  <style>
    #map {position: absolute; top: 0; right: 0; bottom: 0; left: 0;}
  </style>
</head>
<body>
  <div id="map"></div>
  <script>
    var map = new maplibregl.Map({
      container: 'map',
      style: 'style.json',
      center: [121, 24],
      zoom: 10
    });
  </script>
</body>
</html>
使用 python 的 http 模組,將 html 頁面和圖磚目錄跑在 localhost 上:
> ls
index.html output/

> python -m http.server output
Serving HTTP on 0.0.0.0 port 8000 (http://0.0.0.0:8000/) ...
接著為了在地圖中有國家邊界當參考,這邊我們先使用 Demo Tiles 的渲染樣式:
curl -LO https://demotiles.maplibre.org/style.json
接著,在樣式檔案 style.json 中,在 sources 加入剛剛上線的圖磚服務
"peak": {
    "tiles": [
        "http://localhost:8000/output/{z}/{x}/{y}.pbf"
    ],
    "type": "vector"
}
在 layers 中寫入要渲染出來的圖層:
{
    "id": "peak",
    "type": "circle",
    "source": "peak",
    "source-layer": "peak",
    "minzoom": 10,
    "paint": {
        "circle-color": "red",
        "circle-stroke-width": 2,
        "circle-stroke-color": "white"
    }
}
再打開網頁: http:localhost:8000#10.6/22.8226/120.3198 ,就可以看到山頂以紅色圓圈的形式顯示在地圖上啦: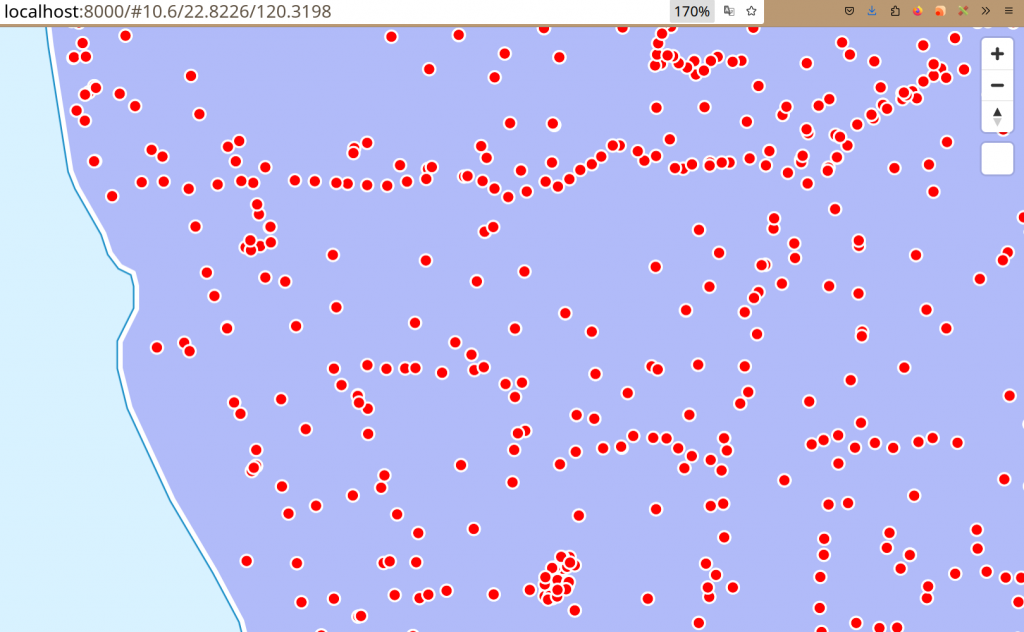
今天我們製作了簡單的向量圖磚,僅僅只包含了有關山頂的資料。往後的文章中會再加入更多的物件來充實登山地圖。相關的程式碼可以在 Github 上查閱。


 iThome鐵人賽