今天來講古,講什麼古,講在 ECharts.js 撞牆的苦!![]()
這個套件太好用了,在應用的地方會拆分成 2 部分:
這裡需要注意幾個地方:
width: 100%; height: 400px,他會判讀成 100px,於是就縮小了const resize = () => lineChart.resize();
window.addEventListener("resize", () => {
    resize();
  });
如果以上都做了,但是還是沒有畫面怎麼辦?
- 可以試著使用
dispatchEvent- 用
nextTick可以把畫圖的 fn 包在裡面
// 元件引入 pie.js
<template>
  <div ref="container" style="width: 600px; height: 400px" />
</template>

<script setup>
import usePie from "./mixin/pie";
import { ref, onMounted } from "vue";

const container = ref(null);

onMounted(() => {
  const { setOption, resize } = usePie(container.value);
  setOption([
    { value: 2200, name: "多拉a夢", itemStyle: { color: "#46B3E6" } },
    { value: 2200, name: "小夫", itemStyle: { color: "#2E279D" } },
    { value: 4400, name: "胖虎", itemStyle: { color: "#4D80E4" } },
  ]);
  window.addEventListener("resize", () => {
    resize();
  });
});
</script>
// 建立 pie.js
import * as echarts from "echarts/core";
import {
  TitleComponent,
  TooltipComponent,
  LegendComponent,
} from "echarts/components";
import { PieChart } from "echarts/charts";
import { LabelLayout } from "echarts/features";
import { CanvasRenderer } from "echarts/renderers";

echarts.use([
  TitleComponent,
  TooltipComponent,
  LegendComponent,
  PieChart,
  CanvasRenderer,
  LabelLayout,
]);

const usePie = (element) => {
  const pieChart = echarts.init(element);
  const setOption = (data) => {
    const option = {
      title: {
        text: "多拉a夢人氣角色",
        subtext: "人氣角色統計",
        left: "center",
      },
      tooltip: {
        trigger: "item",
      },
      legend: {
        orient: "vertical",
        left: "left",
      },
      series: [
        {
          name: "喜歡比例",
          type: "pie",
          radius: "50%",
          data: data,
        },
      ],
    };
    return pieChart.setOption(option);
  };
  const resize = () => pieChart.resize();
  return { setOption, resize };
};

export default usePie;
畫面展示


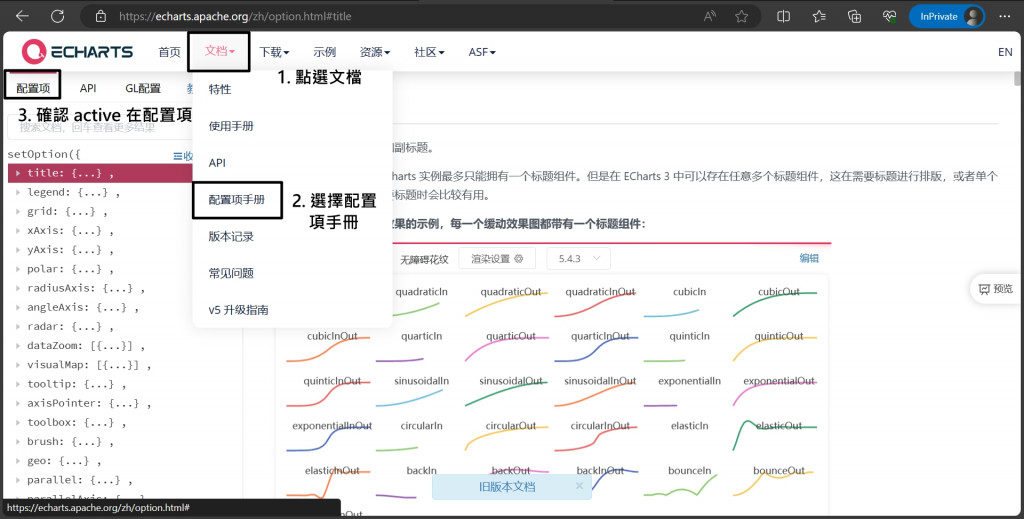
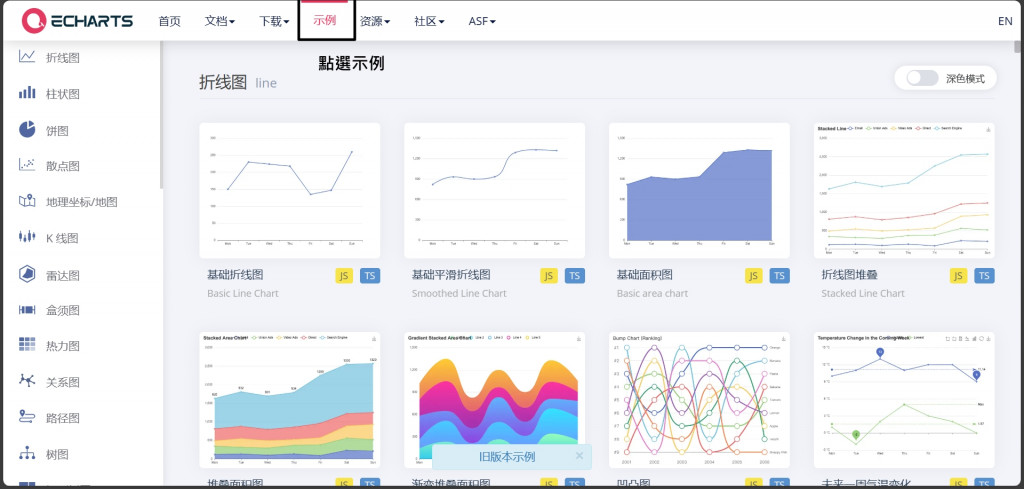
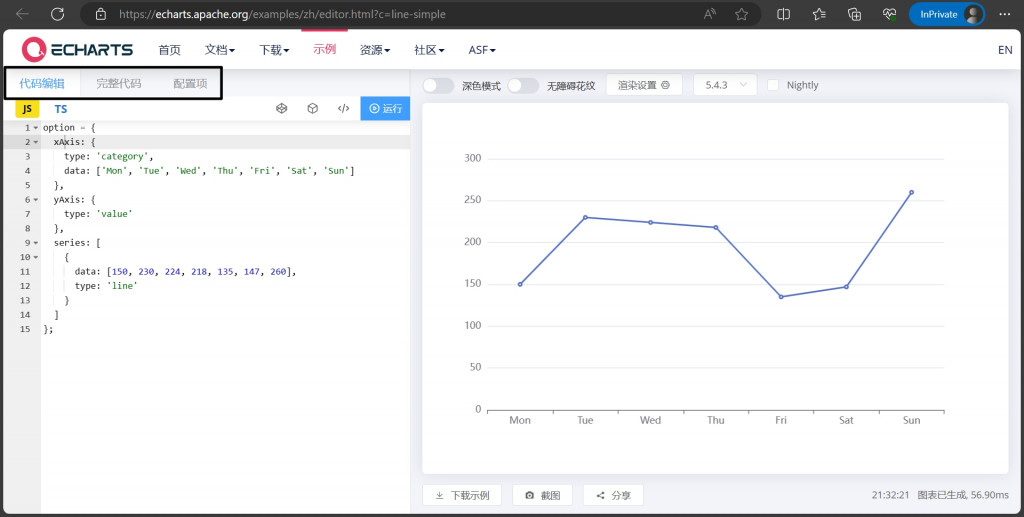
知道以上流程後,我們就可以進入配置項字典啦!
這裡會有些長,但是可以在需要的時候用關鍵字查一下,就可以快速知道屬性名稱,進而去翻閱配置項詳細說明。
圖表標題
  title: {
    show:true,                              //是否顯示
    text: 'Beijing AQI',                    //大標題
    subtext: '我是小標題',                   //小標題
    textAlign:'right',                      //文字水平對齊
    left:'center',                          //組件離容器左側的距離
    top:'top',                              //組件離容器上側的距離
    right:'auto',                           //組件離容器右側的距離
    bottom:'auto'                           //組件離容器下側的距離
  },
tooltip ⭐🌙☀️
  tooltip: {
    trigger: 'axis',                        //觸發類型 'axis'座標軸觸發
    confine:false,                          //是否將 tooltip 框限制在圖表的區域內(可以避免破圖)
    position:['50%', '50%'],                //提示框浮層的位置
    formatter:"{b0}: {c0}<br />{b1}: {c1}", //提示框浮層內容格式器(註1)
    backgroundColor:"transparent",          //標題背景色
    borderColor:"#ccc",                     //邊框顏色
    borderWidth:0,                          //邊框線寬
    padding:5,                              //圖例內邊距,單位:px
  },
註1:
如果要特殊客製化,可以多運用 formatter ,相關內容文件都有範例,這裡要特別提醒一下,如果 PM 要求要客製化內容的 tooltip ,碰巧還是動過手腳的客製化就會出現 tooltip 不像官網呈現的漂亮格式,此時就需要自己手刻,複製F12的程式碼然後寫在 formatter,切記要用style掛 class 是無效的!
grid (圖表位置)
  grid: {
    top: '15%',                  //組件離容器上側的距離,百分比字串或整數數字
    left: '5%',                  //組件離容器左側的距離,百分比字串或整數數字
    right: '15%',                //組件離容器右側的距離,百分比字串或整數數字
    bottom: '10%'                //組件離容器下側的距離,百分比字串或整數數字
  },
xAxis (x 軸)
  xAxis: {
    show: true,                                 //是否顯示 x 軸
    position: 'bottom',                         //x 軸的位置
    type: 'category',                           //座標軸類型
    name: 'Time',                               //座標軸名稱
    data: ['Mon', 'Tue', 'Wed', 'Thu', 'Fri', 'Sat', 'Sun'],
    splitNumber: 5,                             //座標軸的分割段數
    axisLine: {
      show: true,                               //是否顯示座標軸軸線
      onZero: true,                             //X 軸或 Y 軸的軸線是否在另一個軸的 0 刻度上
    },
    axisTick: {                                 //坐標軸刻度相關設定
      show: true,                               //是否顯示座標軸刻度
      alignWithLabel: false,                    //類目軸中在 boundaryGap 為 true 的時候有效
      interval: 'auto',                         //座標軸刻度的顯示間隔
    },
    axisLabel: {                                //座標軸刻度標籤
      show: true,
      margin: 8,                                //刻度標籤與軸線之間的距離
      formatter: function (value, index) {      //使用函數模板,可以先 console.log
         },
    },
    splitLine:{                                 //座標軸在 grid 區域中的分隔線
      show: true,                               //是否顯示分隔線
      interval: 'auto',                         //座標軸分隔線的顯示間隔
    },
    splitArea:{                                 //座標軸在 grid 區域中的分隔區域
      show: false,                              //是否顯示分隔區域
      interval: 'auto'                          //座標軸分隔線的顯示間隔
    }
  },
