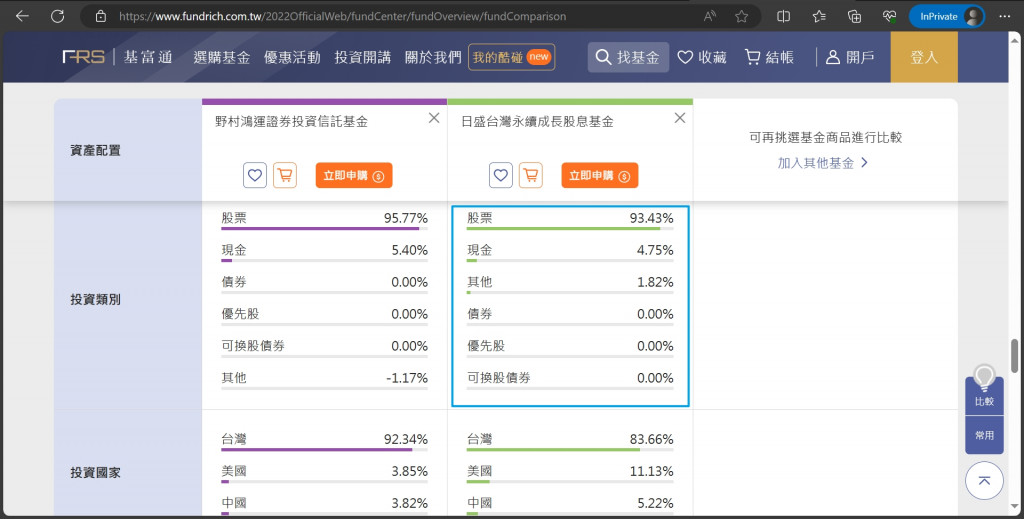
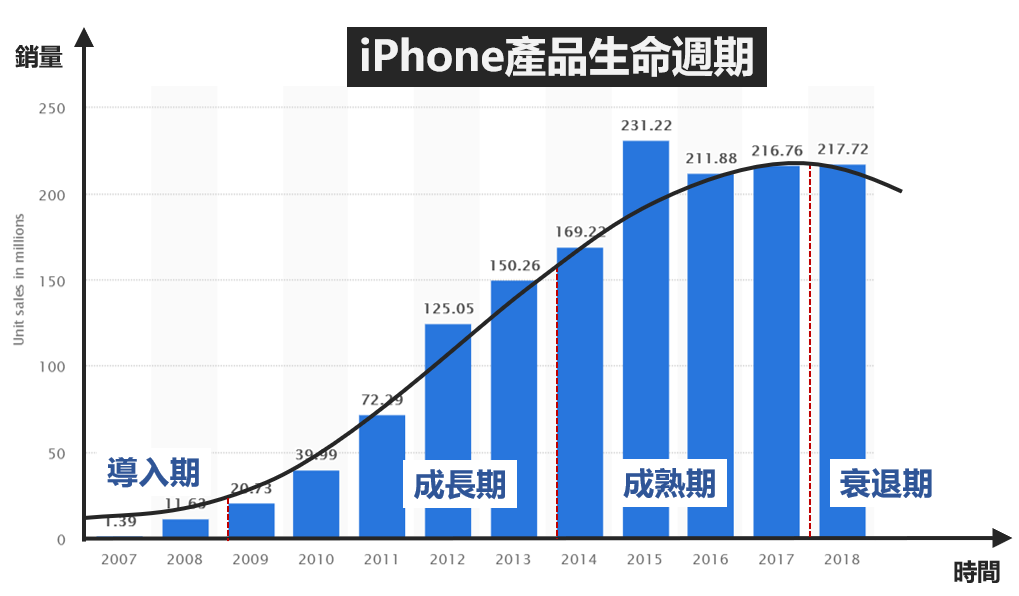
進入進階應用前,要先跟各位分享目前環境,環境確認才方便後續變化使用。
接著可以先去 DEMO 確認資料格式,因為每張圖所需要的資料格式不一定相同,建議可以先去 DEMO 確認,這樣從後端取得資料後就能直接轉換。
axios 後,先根據後端給的 api 網址撈取資料// pie chart 需要的資料格式
const data = {
categories: ['衬衫', '羊毛衫', '雪纺衫', '裤子', '高跟鞋', '袜子'],
values: [5, 20, 36, 10, 10, 20]
}
// api 可能回傳的格式
const data = [
  {
    name: '衬衫',
    qty: 5,
  },
  {
    name: '羊毛衫',
    qty: 20,
  },
  ...
];
環境:Vue3
<script setup>+js+vite
套件:Apache ECharts 5.4 按需引入
重點:一定要記得設定寬高避免 resize 失敗
上集有提到如果是用按需引入,可以把需求元件掛載在 main.js 需要使用的地方再引入即可。
網路上比較多夥伴是把元件抽共用到一個新的 echart.js 再 export default echarts; 引入 main.js,需要用到的元件用元件傳遞的方法傳送,其實這樣的作法在使用很多按需引入的套件時更好方便管理;這裡要示範,所以先統一寫在 main.js 當作我們的起手式。
可以參考這篇文章:在vue3.2中如何使用Echarts,按需导入(使用setup语法糖)
import { createApp } from 'vue';
import { createPinia } from 'pinia';

// 引入 echarts 核心模块,核心模块提供了 echarts 使用必须要的接口。
import * as echarts from 'echarts/core';

// 引入柱状图图表,图表后缀都为 Chart
import { BarChart } from 'echarts/charts';

// 引入提示框,标题,直角坐标系,数据集,内置数据转换器组件,组件后缀都为 Component
import {
  TitleComponent,
  TooltipComponent,
  GridComponent,
  DatasetComponent,
  TransformComponent
} from 'echarts/components';

// 标签自动布局、全局过渡动画等特性
import { LabelLayout, UniversalTransition } from 'echarts/features';

// 引入 Canvas 渲染器,注意引入 CanvasRenderer 或者 SVGRenderer 是必须的一步
import { CanvasRenderer } from 'echarts/renderers';

// 注册必须的组件
echarts.use([
  TitleComponent,
  TooltipComponent,
  GridComponent,
  DatasetComponent,
  TransformComponent,
  BarChart,
  LabelLayout,
  UniversalTransition,
  CanvasRenderer
]);

import App from './App.vue';
import router from './router';

const app = createApp(App);
const pinia = createPinia();

app.use(pinia);
app.use(router);

// Vue.js 元件傳遞
app.provide('echarts', echarts);
app.mount('#app');
現況:仔細看畫面,大家應該有發現當滑鼠靠近圖表其實有 tooltip 出現,接近該條線的數據游標才會轉成小手。
需求:今天滑鼠碰到星期幾點擊後,必須要顯示那天星期幾且 show 出當天花費明細!
當然我們可以使用元件傳遞把星期帶入彈窗,但是...
問題:
重點在最下方的點擊觸發 myChart.getZr().on('click', function (params)
<template>
  <div ref="chart" class="chart_style"/>
</template>

<script setup>
import { onMounted, ref, inject } from 'vue';

// 在組件載入後初始化ECharts圖表
const echarts = inject('echarts');

// 模擬一些範例數據,這裡大部份可以取得後端資料後用陣列語法整理成以下需求格式
const data = [
  {
    name: '多拉a夢',
    type: 'line',
    stack: 'Total',
    data: [150, 230, 224, 218, 135, 147, 260]
  },
  ...
];

const chart = ref(null);
function render() {
  const myChart = echarts.init(chart.value);
  const option = {
    tooltip: {
      trigger: 'axis'
    },
    legend: {
      data: ['多拉a夢', '小夫', '胖虎']
    },
    grid: {
      left: '3%',
      right: '4%',
      bottom: '3%',
      containLabel: true
    },
    xAxis: {
      type: 'category',
      boundaryGap: false,
      data: ['Mon', 'Tue', 'Wed', 'Thu', 'Fri', 'Sat', 'Sun']
    },
    yAxis: {
      type: 'value'
    },
    series: data
  };

  let week = ref('');
  myChart.getZr().on('click', function (params) {
    // 添加圖表的整個canvas區域的點擊事件
    console.log('params1::', params);

    // 獲取到鼠標點擊位置
    const pointInPixel = [params.offsetX, params.offsetY];
    console.log('pointInPixel::', pointInPixel);

    // 判斷點擊位置是否在顯示圖形區域,過濾canvas區域以外的位置
    if (myChart.containPixel('grid', pointInPixel)) {
      let xIndex = myChart.convertFromPixel({ seriesIndex: 0 }, [params.offsetX, params.offsetY])[0];
      console.log('11-點擊事件的dataIndex::', xIndex);

      // 運用找到的索引去對應option中的X軸位置找出名稱
      week.value = option.xAxis.data[xIndex];
      console.log('11-點擊事件的xAxisName::', week.value);
    }
  })

  myChart.setOption(option);
  const resize = () => myChart.resize();
  window.addEventListener('resize', () => {
    resize();
  })
}

onMounted(() => {
  render()
})
</script>
畫面展示
這個新增一個 markLine 屬性在同一張圖表
<template>
<div ref="chart1" class="chart_style" />
</template>
<script setup>
import { onMounted, ref, inject } from 'vue';
import dayjs from 'dayjs';
import isSameOrBefore from 'dayjs/plugin/isSameOrBefore';
// 在组件加载后初始化ECharts图表
const echarts = inject('echarts');
// 模拟一些示例数据
dayjs.extend(isSameOrBefore);
const start_date = dayjs('2023-07-01');
const end_date = dayjs('2023-07-07');
const date_range = [];
for (let date = start_date; date.isSameOrBefore(end_date); date = date.add(1, 'day')) {
date_range.push(date.format('YYYY-MM-DD'))
};
const data = {
chart1: {
data: [120, 132, 101, 134, 90, 230, 210],
type: 'line'
}
};
const chart1 = ref(null);
function render1() {
const myChart = echarts.init(chart1.value);
const option = {
title: {
text: '收入'
},
tooltip: {
trigger: 'axis'
},
legend: {
show: true
},
grid: {
left: '3%',
right: '4%',
bottom: '3%',
containLabel: true
},
xAxis: {
type: 'category',
boundaryGap: false,
data: date_range
},
yAxis: {
type: 'value'
},
series: {
type: 'line',
data: data.chart1.data,
markLine: {
silent: false,
symbol: 'none',
lineStyle: {
color: '#333'
},
label: {
show: true,
fontSize: '11',
backgroundColor: 'rgb(242,242,242)',
borderColor: '#aaa',
borderWidth: 1,
borderRadius: 4,
padding: [4, 10],
lineHeight: 26,
distance: 10,
formatter: function (params) {
console.log('params::', params)
return params.name
}
},
data: [
{
xAxis: '2023-07-04',
name: '家庭聚會'
}
]
}
}
}
myChart.setOption(option);
const resize = () => myChart.resize();
window.addEventListener('resize', () => {
resize();
});
}
onMounted(() => {
render1();
})
</script>
畫面展示
可能出現的 bug,其實是一定會出現的github issue:Markline文字与Y轴文字重叠,有多条Markline时,线条与文字也会重叠,导致看不清楚 #5972
可能問題:如果文字太長,或是連續日期都需要標註標籤,導致標籤重疊,類似...2023-10-07 連假第一天;2023-10-08 連假第二天;2023-10-09 已經補班補課,放假一天;2023-10-10 國慶煙火在台中,歡迎攜伴一起欣賞美麗的煙火
處理方法:
- 用
...:
- 啟動
hover:在markLine中的emphasis- 內容包裝到原生地
tooltip:在tooltip中用formatter客製化
這個目前我在基金網頁還沒看到,但是確實如果在相同 x 軸的屬性、範圍時候,不同張圖也可以做成聯動。
在 function render1() {...} 和 function render2() {...} setOption 後做每個實例的 group id (可以任意命名,但切記:這是聯動的共用名字) 這樣就可以把不同圖表一起聯動。
<template>
  <div ref="chart1" class="chart_style" />
  <div ref="chart2" class="chart_style" />
</template>

<script setup>
import { onMounted, ref, inject } from 'vue';
import dayjs from 'dayjs';
import isSameOrBefore from 'dayjs/plugin/isSameOrBefore';

// 在组件加载后初始化ECharts图表
const echarts = inject('echarts');

// 模拟一些示例数据
dayjs.extend(isSameOrBefore);
const start_date = dayjs('2023-07-01');
const end_date = dayjs('2023-07-07');
const date_range = [];

for (let date = start_date; date.isSameOrBefore(end_date); date = date.add(1, 'day')) {
  date_range.push(date.format('YYYY-MM-DD'));
};
const data = {
  chart1: {
    data: [120, 132, 101, 134, 90, 230, 210],
    type: 'line'
  },
  chart2: {
    data: [220, 182, 191, 234, 290, 330, 310],
    type: 'line'
  }
}

const chart1 = ref(null);
const chart2 = ref(null);
function render1() {
  const myChart = echarts.init(chart1.value)
  const option = {
    title: {
      text: '收入'
    },
    ...
  }

  myChart.setOption(option);

  // 聯動的關鍵:做每個實例的 group id
  myChart.group = 'together';
  echarts.connect('together');
  const resize = () => myChart.resize();
  window.addEventListener('resize', () => {
    resize();
  })
}

function render2() {
  const myChart = echarts.init(chart2.value);
  const option = {
    title: {
      text: '支出'
    },
    ...
  }

  myChart.setOption(option);

  // 聯動的關鍵:做每個實例的 group id
  myChart.group = 'together';
  echarts.connect('together');
  const resize = () => myChart.resize();
  window.addEventListener('resize', () => {
    resize();
  });
}

onMounted(() => {
  render1();
  render2();
})
</script>
畫面展示
其實還有好多想要分享,就像基富通、商周的一些圖表,其實 ECharts.js 也可以做到,只是篇幅很像太多了,所以如果有需求可以在依照提示試試看,或是留言討論

markArea 屬性 )