這篇簡介 KEDA,然後實作兩個使用 ScaledObject 的情況。一個是排程擴展,一個是根據 Prometheus metric 來擴展。
KEDA (Kubernetes-based Event Driven Autoscaler) 是一種基於事件驅動自動擴展的工具,支援多種類的 Scaler。例如連接 AWS CloudWatch、SQS、Prometheus etc。
先來安裝 KEDA,可以透過 Helm 安裝。
helm repo add kedacore https://kedacore.github.io/charts
helm repo update
helm install keda kedacore/keda --namespace keda --create-namespace
這篇完成的時候使用的 KEDA 版本是 2.12.0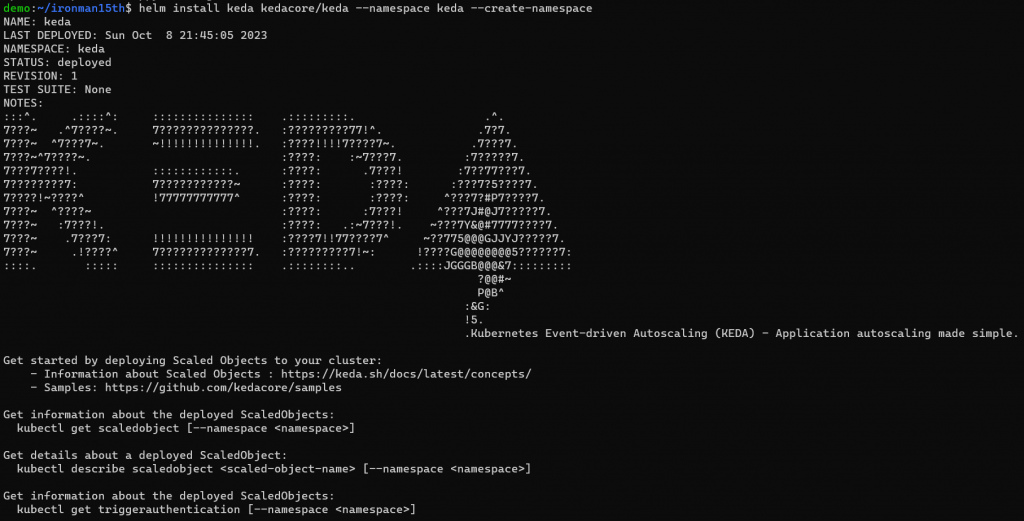
安裝 KEDA 會建立 3 個 Componenets,可以觀察一下 KEDA namespace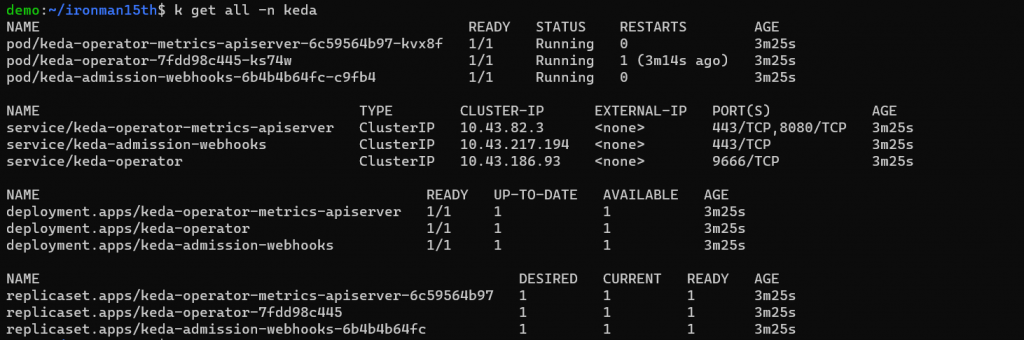
有三個 Deployment,分別作用如下
keda-operator): 負責 activate / deactivates deploymentkeda-operator-metrics-apiserver): 提供 metrics,讓 HPA 能根據數據來驅動 Pods 擴展keda-admission-webhooks): 驗證資源的更改、防止配置錯誤,例如防止多個 ScaledObjects 針對同一個 target 做操作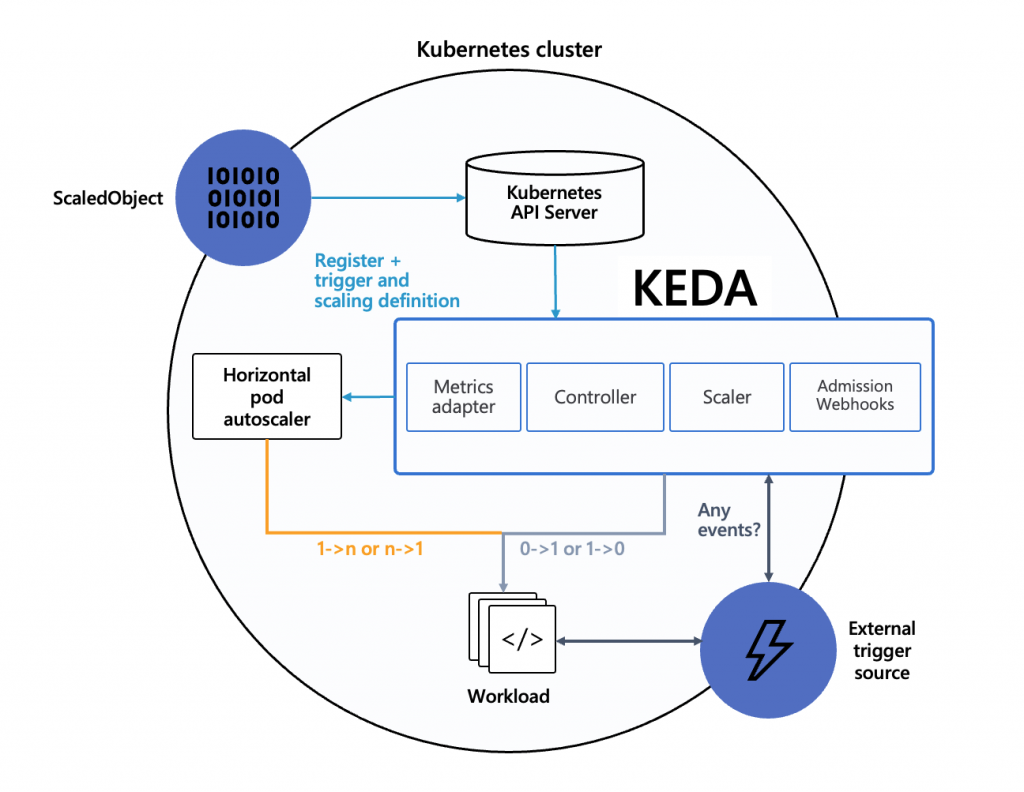
再用 k get crd 看一下有多了哪些自定義的資源 (Custom Resource Definition, CRD)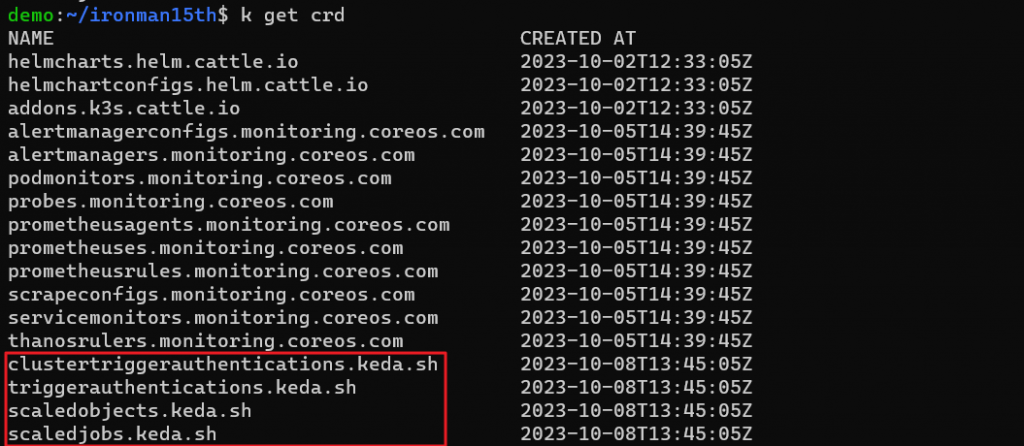
Scaler 有以下這些,是觸發擴展或減少 Pods 的根據。除了 Cluster 外的事件外,也支援原本就有的 CPU、Memory。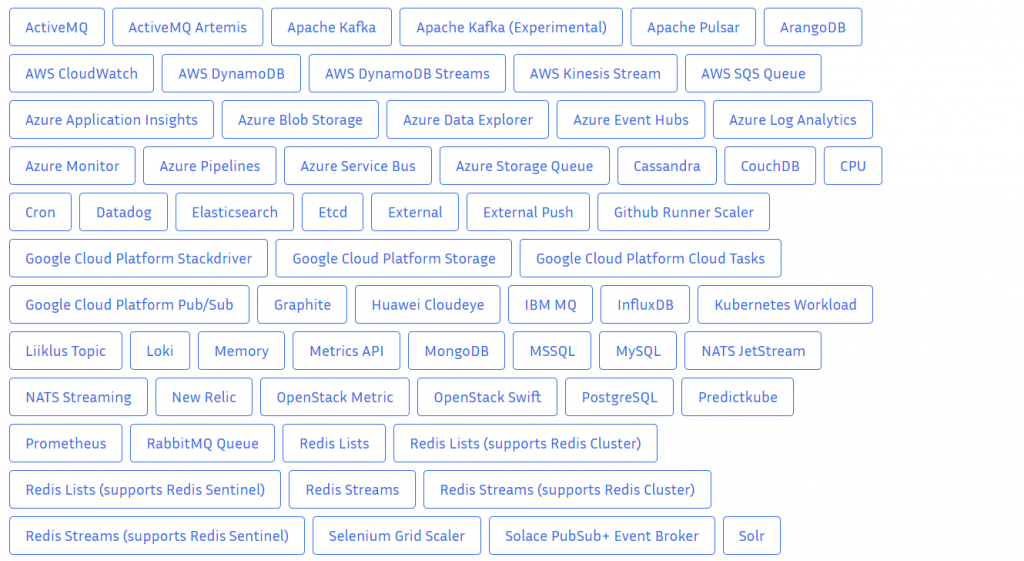
直接實作,使用 Cron event 作為觸發。這段的例子來自 https://medium.com/cuddle-ai/auto-scaling-microservices-with-kubernetes-event-driven-autoscaler-keda-8db6c301b18。
使用場景可以是確定特定時段流量會較大,排程讓 Pods 在特定時段增加副本數。
首先先跑個 Depolyment,這會是 ScaledObject 的 Target。
apiVersion: apps/v1
kind: Deployment
metadata:
  name: nginx
  labels:
    app: nginx
spec:
  selector:
    matchLabels:
      app: nginx
  template:
    metadata:
      labels:
        app: nginx
    spec:
      containers:
      - name: nginx
        image: nginx
        ports:
        - containerPort: 80
再來設置 ScaledObject (https://keda.sh/docs/2.12/scalers/cron/)
apiVersion: keda.sh/v1alpha1
kind: ScaledObject
metadata:
  name: cron-scaled-object
spec:
  scaleTargetRef:
    apiVersion:    apps/v1              # Optional. Default: apps/v1
    kind:          Deployment           # Optional. Default: Deployment
    name:          nginx                # Mandatory. Must be in the same namespace as the ScaledObject
    # envSourceContainerName: {name-of-target-resource} # Optional. Default: .spec.template.spec.containers[0]
  pollingInterval:  30                  # Optional. Default: 30 seconds
  cooldownPeriod:   10                  # Optional. Default: 300 seconds
  idleReplicaCount: 0                   # Optional. Default: ignored, must be less than minReplicaCount
  minReplicaCount:  0                   # Optional. Default: 0
  maxReplicaCount:  10                  # Optional. Default: 100
  fallback:                              # Optional. Section to specify fallback options
    failureThreshold: 3                  # Mandatory if fallback section is included
    replicas: 6                          # Mandatory if fallback section is included
  advanced:                              # Optional. Section to specify advanced options
    restoreToOriginalReplicaCount: false # Optional. Default: false
    horizontalPodAutoscalerConfig:       # Optional. Section to specify HPA related options
      # name: {name-of-hpa-resource}     # Optional. Default: keda-hpa-{scaled-object-name}
      behavior:                          # Optional. Use to modify HPA's scaling behavior
        scaleDown:
          stabilizationWindowSeconds: 300
          policies:
          - type: Percent
            value: 100
            periodSeconds: 15
  triggers:
		- type: cron
	    metadata:
	      timezone: Asia/Taipei  # IANA Time Zone
	      start: 35 * * * *      # Every hour on the 35th minute
	      end: 40 * * * *        # Every hour on the 40th minute
	      desiredReplicas: "10"
先執行 nginx deployment,可以看到現在是 1 個 pod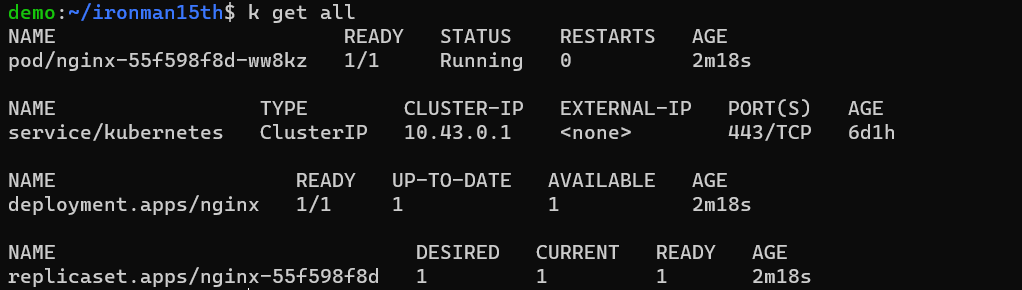
接下來執行 scaled object yaml,稍等一會,執行以下指令會發現 pod 變成 0 了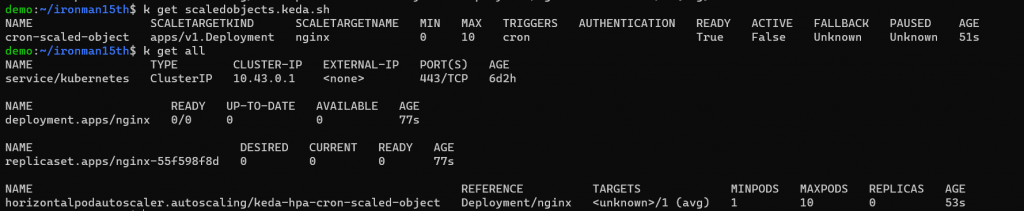
因現在 nginx deployment 受 scaledobjects 的控制,當不在時段內,我令最小的 pod 數量為 0。
等開始時間到了就會自動擴展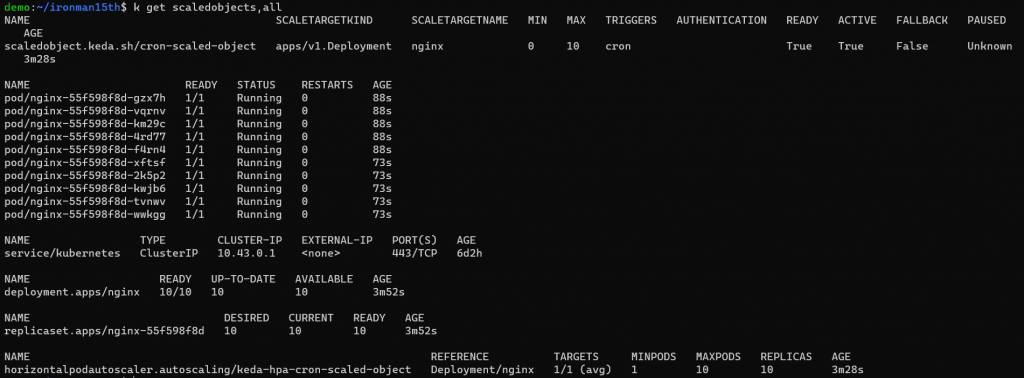
結束時間恢復 Min Pods 數量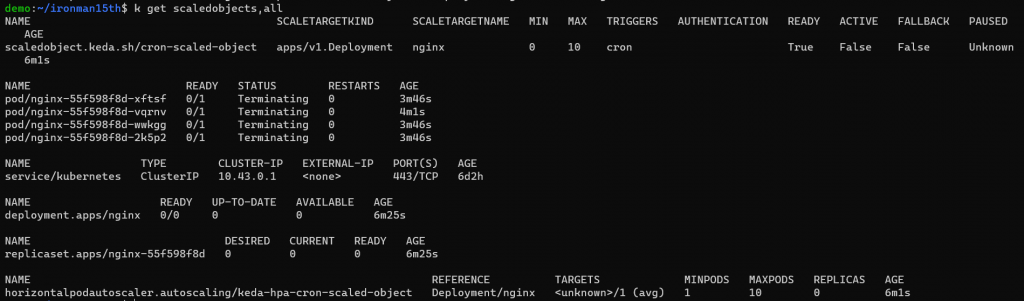
如果刪掉 Scaled Object,對應的 HPA 也會自動被刪除。
再來接一個更彈性的 metrics,透過 Prometheus 對 Cluster 的監控可以決定何時要擴展。但這邊就會需要用到 PromQL 來定義 query。
應用程式的部分就拿官網示範 HPA 用的 php-apache -
apiVersion: apps/v1
kind: Deployment
metadata:
  name: php-apache
spec:
  selector:
    matchLabels:
      run: php-apache
  template:
    metadata:
      labels:
        run: php-apache
    spec:
      containers:
        - name: php-apache
          image: registry.k8s.io/hpa-example
          ports:
            - containerPort: 80
---
apiVersion: v1
kind: Service
metadata:
  name: php-apache
spec:
  ports:
    - port: 80
  selector:
    run: php-apache
再來是建立 Scaled Object (https://keda.sh/docs/2.12/scalers/prometheus/)
apiVersion: keda.sh/v1alpha1
kind: ScaledObject
metadata:
  name: prometheus-scaled-object
spec:
  scaleTargetRef:
    name: php-apache
  pollingInterval: 15
  cooldownPeriod: 30
  minReplicaCount: 1
  maxReplicaCount: 20
  advanced:
    horizontalPodAutoscalerConfig:
      behavior:
        scaleDown:
          stabilizationWindowSeconds: 30
          policies:
            - type: Percent
              value: 50
              periodSeconds: 30
        scaleUp:
          stabilizationWindowSeconds: 0
          policies:
            - type: Percent
              value: 50
              periodSeconds: 10
  triggers:
    - type: prometheus
      metadata:
        # address where keda can reach our prometheus on
        serverAddress: http://prometheus-kube-prometheus-prometheus.monitoring:9090
        # metric on what we want to scale
        metricName: container_network_receive_packets_total
        # if treshold is reached then Keda will scale our deployment
        threshold: "5"
        # Calculate the rate of total network packets received by containers with Pod names matching the regular expression "php-apache.*" in the namespace "default" over the past 1 minute
        query: sum(irate(container_network_receive_packets_total{namespace="default", pod=~"php-apache.*"}[1m]))
Triggers 的部分type: prometheusserverAddress: 哪邊可以找到 Prometheus,因部署在同個 Cluster 中,根據 DNS 的規則可以透過 .連接 PrometheusmetricName & threshold & query: 定義要擴展的指標,以及對這個 metric 的計算方式
要看哪個 metrics、下什麼 query、threshold 要怎麼訂就是關鍵的地方了。但這邊只是 demo 用,就先讓我隨意設。
執行後一樣先看目前數量,因為沒什麼流量所以維持最少的 Pod 1 個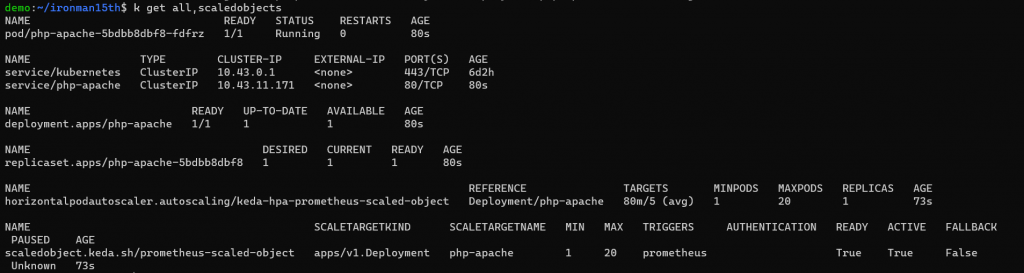
接下來跑一個 Pod 來對 php-apache 發請求
kubectl run -i --tty load-generator --rm --image=busybox:1.28 --restart=Never -- /bin/sh -c "while sleep 0.01; do wget -q -O- http://php-apache; done"
等一下子可以看到 Pods 被自動擴展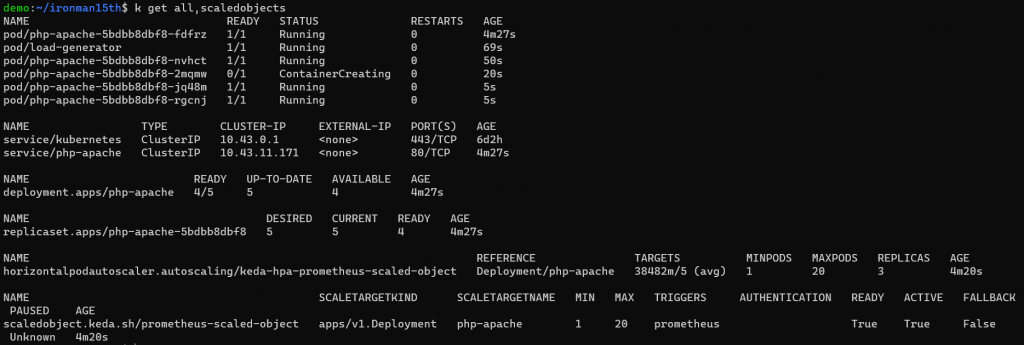
降低發送請求的頻率,改成停 0.1 秒再發,Pod 數量也跟著減少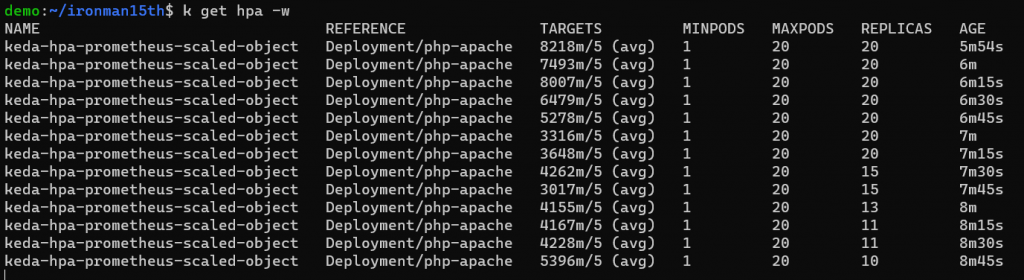
截一張對應 metric 的 Grafana 頁面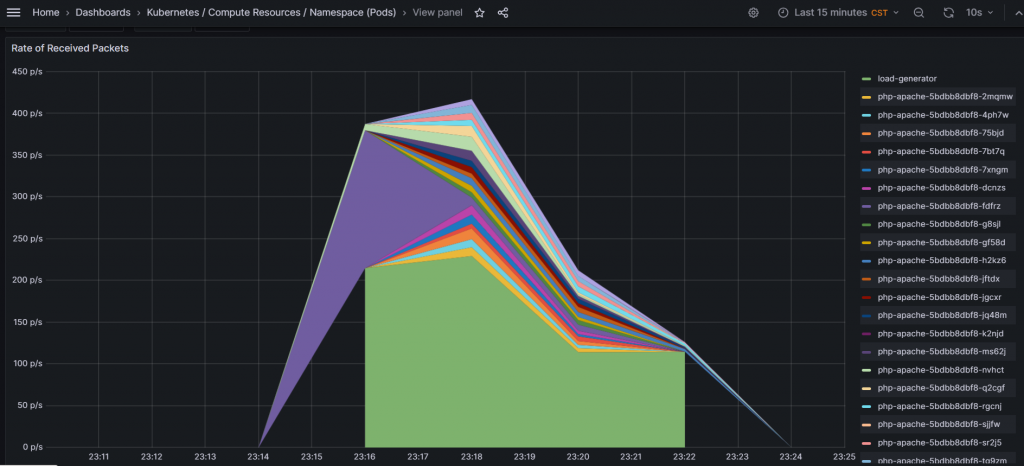
其他 Scalers 可參考官網範例。
另外一個 ScaledObject 的 triggers 可以不只有一種,所以可以搭配傳統的 CPU + 外部事件一起控制應用程式的擴展。例如:
...
	triggers:
    - type: prometheus
      metadata:
        serverAddress: http://prometheus-kube-prometheus-prometheus.monitoring:9090
        metricName: container_network_receive_packets_total
        threshold: "5"
        query: sum(irate(container_network_receive_packets_total{namespace="default", pod=~"php-apache.*"}[1m]))
	- type: cpu
	  metricType: Utilization
	  metadata:
	    type: Utilization
        value: "60"
在進行 load test 時一度無法用瀏覽器開 Grafana 😌
Reference
https://keda.sh/docs/2.12/
https://medium.com/cuddle-ai/auto-scaling-microservices-with-kubernetes-event-driven-autoscaler-keda-8db6c301b18


 iThome鐵人賽