前言:接下來要練習如何應用dplyr套件中的各個函數,我是參考以下網址的練習,但某些變數會修改!如果內容有哪些錯誤的地方,請多多包涵~
正文開始-->
【安裝套件】
首先要先安裝兩個套件,分別為dplyr套件以及gapminder套件處理的資料源。
完整程式碼:
install.packages("dplyr")##安裝dplyr套件
library(dplyr)##載入dplyr套件
install.packages("gapminder")##安裝載入gapminder資料源
library(gapminder)
【檢視資料】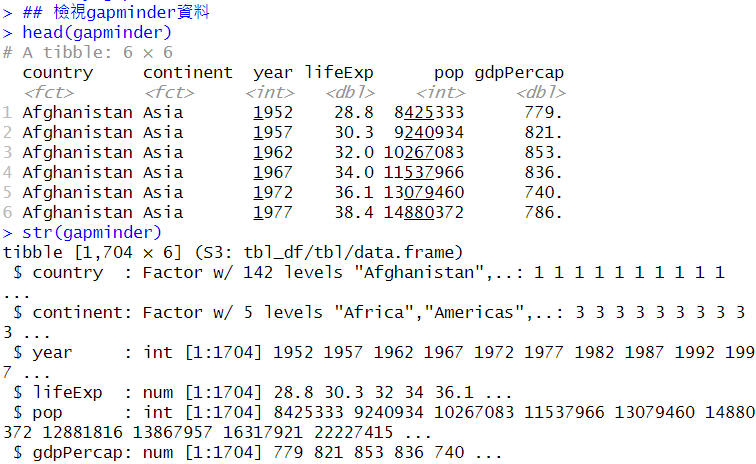
head()與str()函數檢視gapminder資料。【篩選觀測值】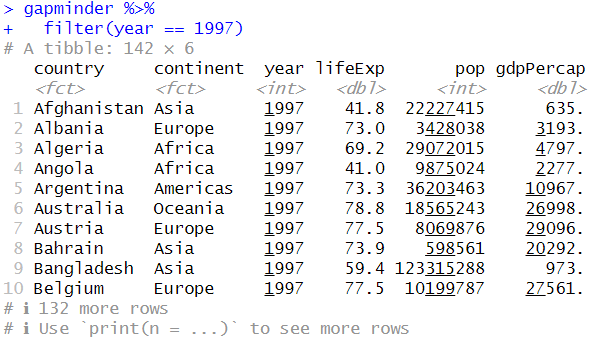
filter()函數篩選1997年的資料。【選擇變數】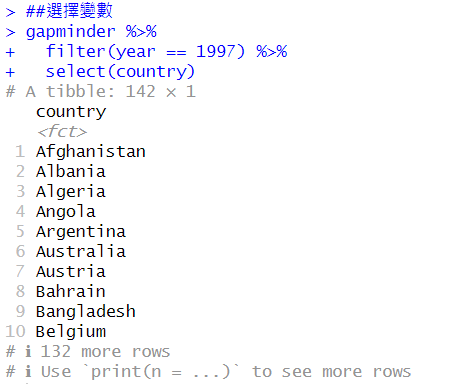
select()函數,輸入資料框的名稱,以及想要選取的變數名稱。在此舉例gapminder 中的 country。【新增欄位】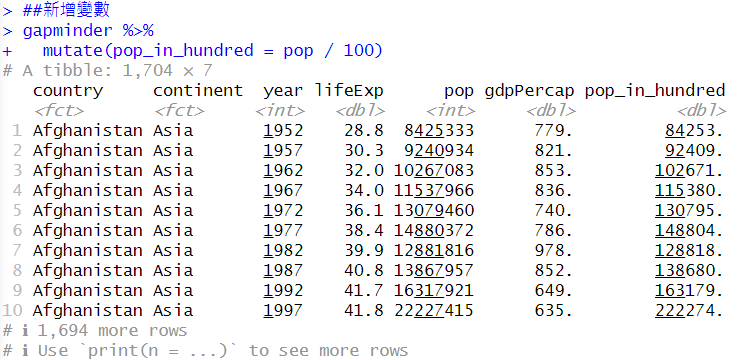
mutate()函數新增變數,在此新增pop_in_hundred。【排序觀測值】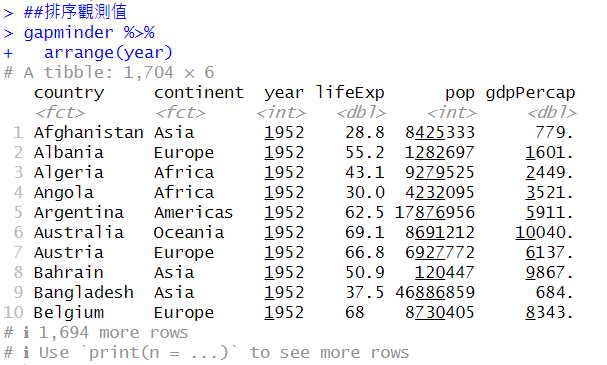
arrange()函數依指定的變數來排序觀測值。【計算統計值】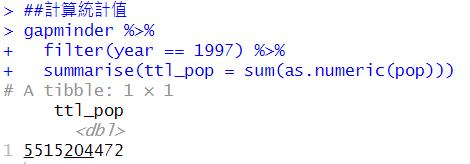
summarise()函數計算1997年全球人口數。【依類別變數分組】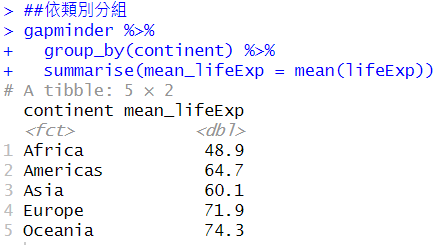
group_by()函數以大洲分組,並使用summarise()函數計算每個洲的平均壽命。參考:


 iThome鐵人賽