在微服務架構中,服務的健康狀態非常重要,原因是當某個服務發生故障時,有可能直接或間接導致依賴於它的其他服務產生問題。如果沒有一個機制能夠得知服務是 不健康的(Unhealthy),就無法在問題發生時迅速找出斷點,這樣會花費更多的時間排除問題,造成更多損失。
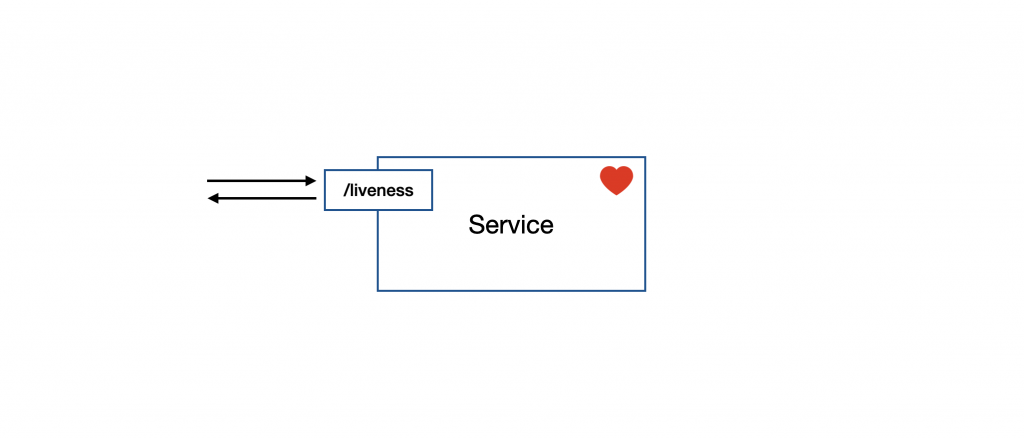
現在比較常見的 健康檢查機制(Health Check) 是服務本身提供特定的 Endpoint,由服務的 基礎設施(Infrastructure) 持續存取 Endpoint 來判斷服務是否 健康(Healthy),如:Kubernetes 的 Liveness、Readiness 以及 Startup Probes,再根據不同的健康狀況決定要重啟服務、中斷流量等。
補充:如何定義一個服務的健康狀態,會根據每個服務的狀況而有所不同。例如:一個使用 MongoDB 的服務,如果遇到 MongoDB 故障,那就可以明確地定義這是不健康的。
那麼,用來檢查健康狀態的 Endpoint 具體會做些什麼呢?簡單來說,我們會定義一些明確的 健康指標(Health Indicator),每當存取該 Endpoint 時,會根據這些指標來決定回應的內容與 HTTP Code。
NestJS 提供了一個叫 Terminus 的函式庫,它整合了一些常用的 Health Indicator,省去了開發者從零開始打造 Indicator 的麻煩,如果內建的 Indicator 不夠用,NestJS 還提供了 Custom Health Indicator 的功能,以增進開發體驗。
以下是內建的 Health Indicator:
HttpHealthIndicator
TypeOrmHealthIndicator
MongooseHealthIndicator
SequelizeHealthIndicator
MikroOrmHealthIndicator
PrismaHealthIndicator
MicroserviceHealthIndicator
GRPCHealthIndicator
MemoryHealthIndicator
DiskHealthIndicator
注意:由於內建的 Health Indicator 數量不少,故本篇教學將會挑選其中幾個作為範例。
透過下方指令進行安裝:
$ npm install @nestjs/terminus
補充:在使用某些內建 Health Indicator 時,可能需要額外安裝依賴的套件,如:
MongooseHealthIndicator會需要安裝mongoose,如果不確定所使用的 Indicator 需要哪些額外套件,可以直接在開發階段啟動服務,NestJS 會在編譯階段報錯以通知開發者,非常貼心。
首先,透過 NestJS CLI 產生 HealthModule 以及 HealthController 來建立 Health Check 要使用的 Endpoint:
$ nest generate module health
$ nest generate controller health
接著,在 HealthModule 中匯入 TerminusModule。下方為範例程式碼:
import { Module } from '@nestjs/common';
import { TerminusModule } from '@nestjs/terminus';
import { HealthController } from './health.controller';

@Module({
  imports: [TerminusModule],
  controllers: [HealthController],
})
export class HealthModule {}
接下來調整 HealthController 的內容,新增 liveness 方法並加上 @Get 裝飾器,這裡還需要額外添加 @HealthCheck 裝飾器來標記該 Endpoint 是用來做 Health Check 的,此外,需注入 HealthCheckService 並在 liveness 方法中使用其 check 方法作為回傳值。下方是範例程式碼:
import { Controller, Get } from '@nestjs/common';
import { HealthCheck, HealthCheckService } from '@nestjs/terminus';

@Controller('health')
export class HealthController {
  constructor(private readonly healthCheckService: HealthCheckService) {}

  @HealthCheck()
  @Get('liveness')
  liveness() {
    return this.healthCheckService.check([]);
  }
}
@HealthCheck 裝飾器在預設情況下會 避免回傳值被快取,同時也會在使用 Swagger 時 自動產生文件。當然,也可以透過指定參數 noCache 為 false 來啟用快取、透過指定 swaggerDocumentation 為 false 來避免自動產生 Swagger 文件。下方是範例程式碼:
import { Controller, Get } from '@nestjs/common';
import { HealthCheck, HealthCheckService } from '@nestjs/terminus';

@Controller('health')
export class HealthController {
  constructor(private readonly healthCheckService: HealthCheckService) {}

  @HealthCheck({ noCache: false, swaggerDocumentation: false })
  @Get('liveness')
  liveness() {
    return this.healthCheckService.check([]);
  }
}
從上方範例還可以看到,HealthCheckService 的 check 方法帶入了一個空陣列,事實上,它帶入的參數必須符合 HealthIndicatorFunction[] 的型別,每個 HealthIndicatorFunction 都是回傳 Health Indicator 結果的函式,以上方範例來說,當我們使用 Postman 透過 GET 方法存取 http://localhost:3000/health/liveness 會得到一個固定形式的回傳值,如下所示:
{
  "status": "ok",
  "info": {},
  "error": {},
  "details": {}
}
這個回傳格式每個欄位的意義如下:
status:如果有任何一個 Health Indicator 的結果為不健康,這個欄位就會是 error,如果服務正在關閉但還持續收到請求,那就會是 shutting_down。info:如果 Health Indicator 的結果是健康的,就會將該 Health Indicator 的相關資訊記錄在這,像是 status 為 up。error:如果 Health Indicator 的結果是不健康的,就會將該 Health Indicator 的相關資訊記錄在這,像是 status 為 down。details:會將上述 info 與 error 的資訊統整在這個欄位。HttpHealthIndicator 是用於 HTTP 請求相關的 Health Indicator,假如服務依賴另一個服務所提供的資訊,並且該資訊是採用 HTTP 協定來存取,那就可以考慮使用 HttpHealthIndicator。在使用之前,需要先安裝下方套件:
$ npm install axios @nestjs/axios
安裝好之後,透過注入的方式來使用 HttpHealthIndicator。下方為範例程式碼,在 HealthController 注入 HttpHealthIndicator:
// ...
import {
  HealthCheck,
  HealthCheckService,
  HttpHealthIndicator
} from '@nestjs/terminus';

@Controller('health')
export class HealthController {
  constructor(
    private readonly healthCheckService: HealthCheckService,
    private readonly httpHealthIndicator: HttpHealthIndicator,
  ) {}

  // ...
}
HttpHealthIndicator 提供了兩個方法:
pingCheck:用來檢查指定的資源是否有回應。responseCheck:可以根據回應的內容來判斷是否健康。下方是範例程式碼,透過 pingCheck 定義一個名為 google 的 Health Indicator 並判斷 https://google.com/ 是否有回應。此外,透過 responseCheck 定義一個名為 json-place-holder 的 Health Indicator 並判斷 https://jsonplaceholder.typicode.com/todos 的資料筆數是否大於 0:
// ...

interface Todo {
  userId: number;
  id: number;
  title: string;
  completed: boolean;
}

@Controller('health')
export class HealthController {
  // ...

  @HealthCheck()
  @Get('liveness')
  liveness() {
    return this.healthCheckService.check([
      () => this.httpHealthIndicator.pingCheck('google', 'https://google.com/'),
      () =>
        this.httpHealthIndicator.responseCheck<Array<Todo>>(
          'json-place-holder',
          'https://jsonplaceholder.typicode.com/todos',
          (response) => {
            return response.data.length > 0;
          },
        ),
    ]);
  }
}
使用 Postman 透過 GET 方法存取 http://localhost:3000/health/liveness,在兩者條件都滿足的情況下會收到下方回應:

DiskHealthIndicator 是用來檢查硬碟空間的 Health Indicator,假如服務的磁碟空間不足可能導致服務產生問題時可以使用。
DiskHealthIndicator 提供了一個方法:
checkStorage:檢查磁碟空間是否充足。下方為範例程式碼,注入 DiskHealthIndicator 並在 liveness 方法中使用其 checkStorage 方法來定義名為 storage1 的 Health Indicator,透過指定 path 來指定要檢查的資料夾路徑為 /,並使用 threshold 來指定上限值為 10 MB,除此之外,再透過 checkStorage 方法定義一個名為 storage2 的 Health Indicator,指定 path 為 /,並使用 thresholdPercent 來指定是否超過總容量的 0.01:
// ...
import {
  DiskHealthIndicator,
  HealthCheck,
  HealthCheckService,
} from '@nestjs/terminus';

@Controller('health')
export class HealthController {
  constructor(
    private readonly healthCheckService: HealthCheckService,
    private readonly diskHealthIndicator: DiskHealthIndicator,
  ) {}

  @HealthCheck()
  @Get('liveness')
  liveness() {
    return this.healthCheckService.check([
      () =>
        this.diskHealthIndicator.checkStorage('storage1', {
          path: '/',
          threshold: 10 * 1024 * 1024,
        }),
      () =>
        this.diskHealthIndicator.checkStorage('storage2', {
          path: '/',
          thresholdPercent: 0.01,
        }),
    ])
  }
}
補充:
threshold是以 Byte 為單位進行計算、thresholdPercent是以小數位來表示百分比,如:0.01為1%。
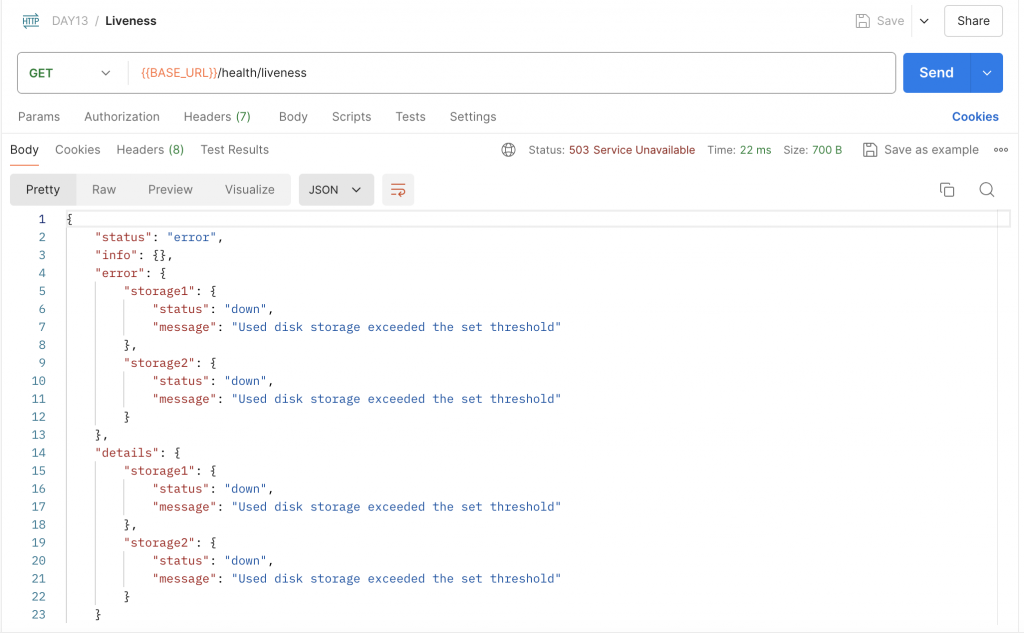
使用 Postman 透過 GET 方法存取 http://localhost:3000/health/liveness,在兩者條件都不滿足的情況下會收到下方回應:
MemoryHealthIndicator 是用來檢查記憶體用量的 Health Indicator。
MemoryHealthIndicator 提供了兩個方法:
checkHeap:檢查 Heap 的實際用量是否超過指定大小。checkRSS:檢查 RSS 的實際用量是否超過指定大小。下方為範例程式碼,注入 MemoryHealthIndicator 並在 liveness 方法中使用其 checkHeap 方法來定義名為 memory_heap 的 Health Indicator,透過帶入 50 * 1024 * 1024 到第二個參數來指定上限值為 50 MB,除此之外,再透過 checkRSS 方法定義一個名為 memory_rss 的 Health Indicator,透過帶入 100 * 1024 * 1024 到第二個參數來指定上限值為 100 MB:
// ...
import {
  HealthCheck,
  HealthCheckService,
  MemoryHealthIndicator,
} from '@nestjs/terminus';

@Controller('health')
export class HealthController {
  constructor(
    private readonly healthCheckService: HealthCheckService,
    private readonly memoryHealthIndicator: MemoryHealthIndicator,
  ) {}

  @HealthCheck()
  @Get('liveness')
  liveness() {
    return this.healthCheckService.check([
      () =>
        this.memoryHealthIndicator.checkHeap('memory_heap', 50 * 1024 * 1024),
      () =>
        this.memoryHealthIndicator.checkRSS('memory_rss', 100 * 1024 * 1024),
    ])
  }
}
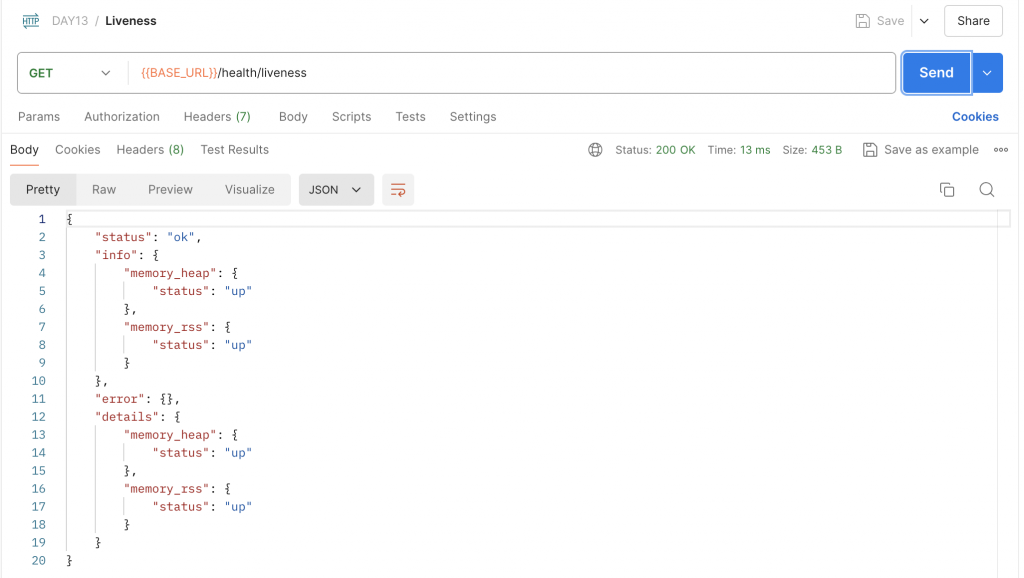
使用 Postman 透過 GET 方法存取 http://localhost:3000/health/liveness,在兩者條件都滿足的情況下會收到下方回應:
如果內建的 Health Indicator 沒有辦法滿足使用情境,NestJS 有提供 Custom Health Indicator 的作法。接下來我們會實作一個 CpuHealthIndicator 來檢測 CPU 的使用狀況,在開始之前,先安裝會使用到的第三方套件:
$ npm install node-os-utils
以及它的型別定義檔:
$ npm install @types/node-os-utils -D
補充:
node-os-utils是一套 Node.js 的函式庫,包裝一些函式讓開發者可以更輕易取得 OS 層級的相關資訊,有興趣可以參考官方文件。
接著,新增名為 CpuHealthIndicator 的 class 並繼承 HealthIndicator,同時需要加上 @Injectable 裝飾器。下方是範例程式碼:
import { Injectable } from '@nestjs/common';
import { HealthIndicator } from '@nestjs/terminus';

@Injectable()
export class CpuHealthIndicator extends HealthIndicator {}
實作一個 checkUsage 的方法來檢查 CPU 在一秒內的平均使用率,它回傳的格式必須符合 Promise<HealthIndicatorResult>。下方是範例程式碼,在該方法定義兩個參數,分別是用來定義 Health Indicator 名稱的 key 與使用率的上限值 thresholdPercent,透過 node-os-utils 的 cpu 提供的 usage 方法來取得一秒內 CPU 的平均使用率,再根據 thresholdPercent 來判斷是否健康,接著,透過 HealthIndicator 提供的 getStatus 方法將 key、isHealthy 與相關資訊包裝成 HealthIndicatorResult 的格式,最後再根據 isHealthy 的狀況決定是直接回傳結果還是拋出 HealthIndicatorError:
import { Injectable } from '@nestjs/common';
import {
  HealthCheckError,
  HealthIndicator,
  HealthIndicatorResult,
} from '@nestjs/terminus';
import { cpu } from 'node-os-utils';

@Injectable()
export class CpuHealthIndicator extends HealthIndicator {
  async checkUsage(
    key: string,
    thresholdPercent: number,
  ): Promise<HealthIndicatorResult> {
    const usage = await cpu.usage();
    const isHealthy = usage <= thresholdPercent * 100;
    const result = this.getStatus(key, isHealthy, { usage: `${usage}%` });

    if (isHealthy) {
      return result;
    }

    throw new HealthCheckError(
      'The CPU usage has exceeded the given threshold.',
      result,
    );
  }
}
實作完 CpuHealthIndicator 後,將它加入 HealthModule 的 providers 內:
// ...
import { CpuHealthIndicator } from './cpu-health-indicator';

@Module({
  // ...
  providers: [CpuHealthIndicator],
})
export class HealthModule {}
注意:在實作 Custom Health Indicator 時,應考慮將它們歸類在適當的 Module 內,不一定放在
HealthModule內是最好的選擇。
最後,在 HealthController 內注入 CpuHealthIndicator 並在 liveness 方法中使用其 checkUsage 方法來定義名為 cpu_usage 的 Health Indicator,透過帶入 0.01 指定平均使用率不得超過 1%:
// ...
import {
  HealthCheck,
  HealthCheckService,
} from '@nestjs/terminus';
import { CpuHealthIndicator } from './cpu-health-indicator';

@Controller('health')
export class HealthController {
  constructor(
    private readonly healthCheckService: HealthCheckService,
    private readonly cpuHealthIndicator: CpuHealthIndicator,
  ) {}

  @HealthCheck()
  @Get('liveness')
  liveness() {
    return this.healthCheckService.check([
      () => this.cpuHealthIndicator.checkUsage('cpu_usage', 0.01),
    ])
  }
}
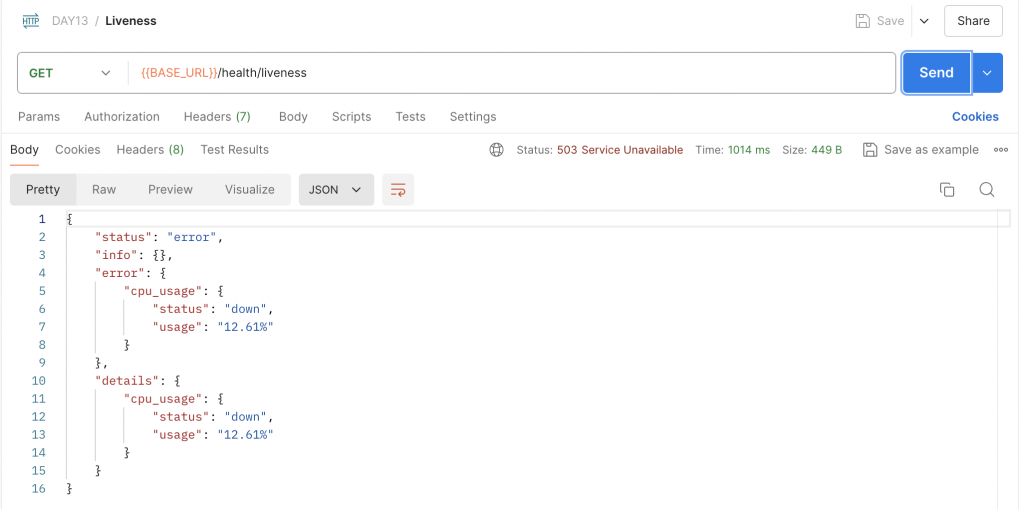
使用 Postman 透過 GET 方法存取 http://localhost:3000/health/liveness,在條件不滿足的情況下會收到下方回應:
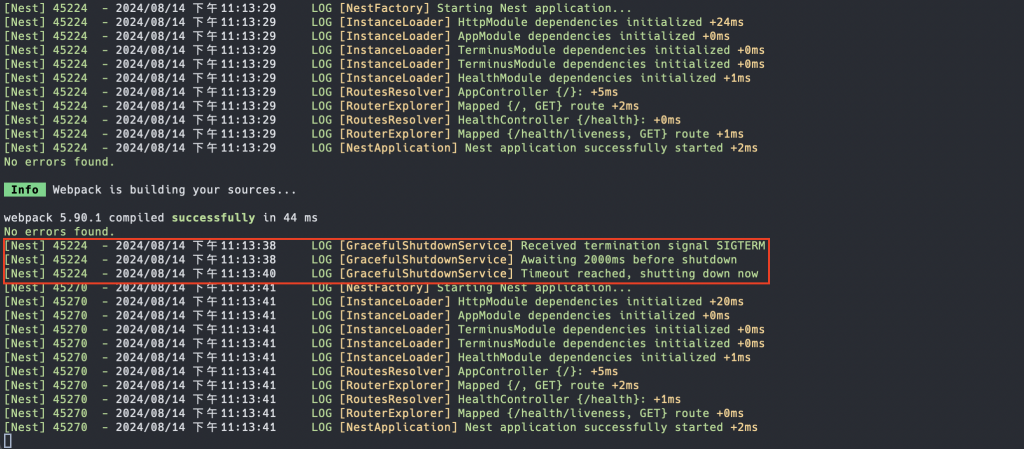
Terminus 除了提供 Health Indicator 相關功能外,在 NestJS 10 之後的版本還提供了 延遲 Graceful Shutdown(Graceful Shutdown Timeout) 的功能,這個功能在 Kubernetes 等環境下會有幫助,如果服務在啟動時需要一段準備時間,這時候 Graceful Shutdown 了原來的服務,就會產生 停機(Downtime),所以只要把 Graceful Shutdown 的延遲時間調得比準備時間還大,就可以實現 **零停機(Zero Downtime)**的效果。
要使用 Graceful Shutdown Timeout 只需要在 AppModule 匯入 TerminusModule,並使用其 forRoot 靜態方法,指定要延遲的 毫秒(ms) 給 gracefulShutdownTimeoutMs 參數。下方是範例程式碼,指定 2 秒後再 Graceful Shutdown:
import { Module } from '@nestjs/common';
import { TerminusModule } from '@nestjs/terminus';
// ...

@Module({
  imports: [
    // ...
    TerminusModule.forRoot({
      gracefulShutdownTimeoutMs: 2000,
    })
  ],
  // ...
})
export class AppModule {}
注意:由於 Graceful Shutdown Timeout 會需要使用
beforeApplicationShutdown這個 Lifecycle Hook,所以需要在main.ts內呼叫app.enableShutdownHooks(),這樣才會正常運作,詳細說明可以參考我之前分享的文章。
測試的方式很簡單,先透過 Watch 模式啟動服務,此時,在任一個檔案進行儲存,就可以在終端機看到相關訊息:
回顧一下今天的重點,一開始先講解了在微服務架構下 Health Check 的重要性以及常見的實作方式,接著,介紹 NestJS 提供的 Terminus 函式庫,它內建了多種常用的 Health Indicator,同時也支援 Custom Health Indicator,方便開發者根據實際需求進行擴充。最後,如果是使用 Kubernetes 等 Infrastructure 且服務在啟動時需要一段準備時間,那就可以透過 Graceful Shutdown Timeout 的方式來延遲關閉服務,達到零停機效果。
這篇的內容著重於建立 Health Check 的機制來得知服務的健康狀態,結合 Kubernetes 等 Infrastructure 可以做到一定程度的重啟服務、中斷流量等,但這種機制適合用在 問題發生的當下,如果希望做到 提前預警、監控 就需要透過其他方式來進行,下一篇將會帶大家了解一下如何監控微服務,敬請期待!