在上一章中,我們已經建立了自定義的 Scene、Variable 和 Control。本章將了解在不使用 SceneQueryRunner 的情況下,如何使用 Grafana 的內部請求方法取得數據資料,且在取得最 raw 的資料後,如何格式化這些資料,以及如何使用 SceneDataNode 來管理數據。最後,我們將學習如何使用 PanelBuilder 來視覺化呈現這些數據。
在 Scene 中,取得資料的方法通常會使用 SceneQueryRunner,而該實例所請求的 API 會是 /api/ds/query,但在某些情況下,例如想要查找某個 data source 的所有 labels 這時候會需要直接訪問 data source 的原生 API,例如: /api/datasources/proxy/uid/{uid}/{datasource_proxy_route}。而這些非表準的請求會需要使用 Grafana 的內部請求方法。Grafana 提供了一些內部方法來處理數據請求和管理。這些方法能夠與 Grafana 的後端系統進行交互,取得所需的數據資料。在本節中,我們將介紹兩個重要的方法:getBackendSrv 和 getDataSourceSrv。
getBackendSrv 用於取得 BackendSrv 實例,該實例可用於通過 HTTP(S) 與後端(如 Grafana 後端、data source 等)進行交互。getBackendSrv 提供了一個統一的接口來處理各種 HTTP 請求,包括 GET、POST、PUT、DELETE 等方法,使得與 Grafana 後端服務的交互變得更加簡單和標準化。getBackendSrv 提供以下主要方法,所有方法都會返回 Promise 或 Observable:
在我們的範例中,使用了 getBackendSrv().post() 方法來取得 testdata 中以 __house_locations 為 alias 的溫度資料:
import { getBackendSrv } from "@grafana/runtime";

const getTemperatureData = async (
  timeRange: SceneTimeRangeState,
  alias = "__house_locations",
  seriesCount = 10,
  refId = "A"
) => {
  const res = await getBackendSrv().post<{ results: { [key: string]: { frames: DataFrameJSON[] } } }>(
    "/api/ds/query?ds_type=grafana-testdata-datasource",
    {
      queries: [
        {
          refId,
          datasource: {
            type: "grafana-testdata-datasource",
            uid: "PD8C576611E62080A",
          },
          scenarioId: "random_walk",
          seriesCount,
          alias,
          min: 10,
          max: 27,
          datasourceId: 1,
          intervalMs: 300000,
          maxDataPoints: 100,
        },
      ],
      from: timeRange.value.from.valueOf().toString(),
      to: timeRange.value.to.valueOf().toString(),
    }
  );
  return res;
};
雖然在這個範例中我們沒有直接使用 getDataSourceSrv(),但它是另一個重要的 Grafana 內部服務,用於管理和訪問 data source。getDataSourceSrv() 用於檢索 DataSourceSrv,它是與作為 plugin 添加的 data source 進行溝通的入口點。它提供了以下主要方法:
以下是一個使用 getDataSourceSrv 的範例,使用 getDataSourceSrv().getList() 方法獲取了所有 type 為 prometheus 的 data source:
import { getDataSourceSrv } from "@grafana/runtime";

async function getPrometheusDataSources() {
  try {
    // 取得所有 type 為 prometheus 的 data source
    const info = getDataSourceSrv()
      .getList()
      .filter((ds) => {
        return ds.type === "prometheus";
      });

    console.log("Query result:", info);
  } catch (error) {
    console.error("Error fetching data:", error);
  }
}

getPrometheusDataSources();
💡TIP
如果有其他 Grafana API 的需求,在開發環境中可以透過 http://localhost:<local_port>/swagger 進行查詢。
接續著使用了內部請求方法取得資料後,我們需要將取得的資料格式化各種符合使用需求的形式。例如本次的實作範例中,會需要使用 getTemperatureData 取得的資料轉換成所有 Room 的列表以及依據指定的 Room 取得該 Room 的溫度資料。因此我們會需要將取得的資料格式化成以下形式:
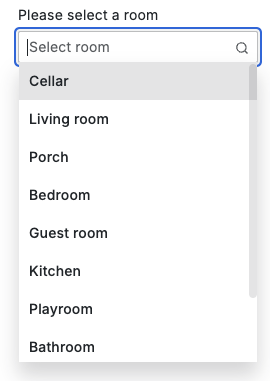
在上一章中,我們已經建立了一個 RoomVariable 的變數,而變數的 Component 是一個 @grafana/ui 的 Select 元件,因此我們可以透過這個元件來取得所有 Room 的列表,並將其轉換成我們需要的格式:
_onActivate 方法,並在 constructor 中使用 bind 將其綁定到當前實例上。_onActivate 方法中呼叫 initOptions 方法。這樣的設計可以確保 RoomVariable 在初始化時能夠正確地載入和設定 Room 列表資料。同時,我們也遵循了 Grafana Scene 的最佳實踐,使用 activation handler 來處理非同步的初始化過程。
💡NOTICE
要特別注意當有設定自定義的 function 時,需要使用 bind 將其綁定到當前實例上。
export class RoomVariable extends SceneObjectBase<RoomVariableState> {
  public constructor(state?: Partial<RoomVariableState>) {
    // 初始化變數
    super({...});

    this.initOptions = this.initOptions.bind(this);
    this.addActivationHandler(this._onActivate);
  }

  private _onActivate = () => {
    this.initOptions();
  };

  //<---- 其他 function 和 Component 設置 ---->
  public initOptions = async () => {
    const timeRange = sceneGraph.getTimeRange(this).state;
    this.setState({ isLoading: true });
    const res = await getTemperatureData(timeRange);

    const options = res.results.A.frames.map((frame: DataFrameJSON) => {
      return {
        label: frame.schema?.fields[1].name || "",
        value: frame.schema?.fields[1].name || "",
      };
    });
    this.setState({ options, isLoading: false });
  };
}

下一個需要轉換的情境是將取得的資料轉換成 Grafana 的 DataFrame 格式,這樣才能夠在 Grafana 中顯示。在這個範例中,我們使用 toDataFrame 函數進行數據轉換。而 toDataFrame 是一個 utility function,可以將任何型別的資料,經過各式的判斷轉換成 Grafana 的 DataFrame 格式。而本範例中希望將取得的資料轉換成時間序列的資料,而 fields 的資料格式會需要時間以及溫度兩個欄位,因此我們需要將取得的資料轉換成以下格式:
const formatPanelData = (frame: DataFrameJSON) => {
  return toDataFrame({
    fields: [
      {
        name: frame.schema?.fields[1].name || "",
        type: FieldType.number,
        values: frame.data?.values[1],
      },
      {
        name: "time",
        type: FieldType.time,
        values: frame.data?.values[0],
      },
    ],
  });
};
在選定了 Room 後,我們需要取得指定 Room 的溫度資料,當設定好轉換格式的 function 後,可以建立一個 onSubmit 的方法來取得指定 Room 的溫度資料:
sceneGraph.getTimeRange 和 sceneGraph.lookupVariable 取得。public onSubmit = async () => {
const timeRange = sceneGraph.getTimeRange(this).state;
const variableState = sceneGraph.lookupVariable('room', this)?.getValue();
if (!variableState) {
return;
}
const results = await getTemperatureData(timeRange, String(variableState), 1, 'Temp');
const formattedData = results.results.Temp.frames.map(formatPanelData);
this.setState({ panelData: formattedData });
};
SceneDataNode 的主要功能是封裝 PanelData,這是 Grafana 中用於儲存 Panel Date 的標準格式。它包含了數據資料系列(series)、加載狀態(state)和時間範圍(timeRange)等資訊。通過使用 SceneDataNode,可以更自由地在 Scene 中管理 Panel 所需要的資料。以下是在本範例中所建立的 SceneDataNode:
new SceneDataNode({
  data: {
    series: tsData,
    state: LoadingState.Done,
    timeRange,
  },
}),
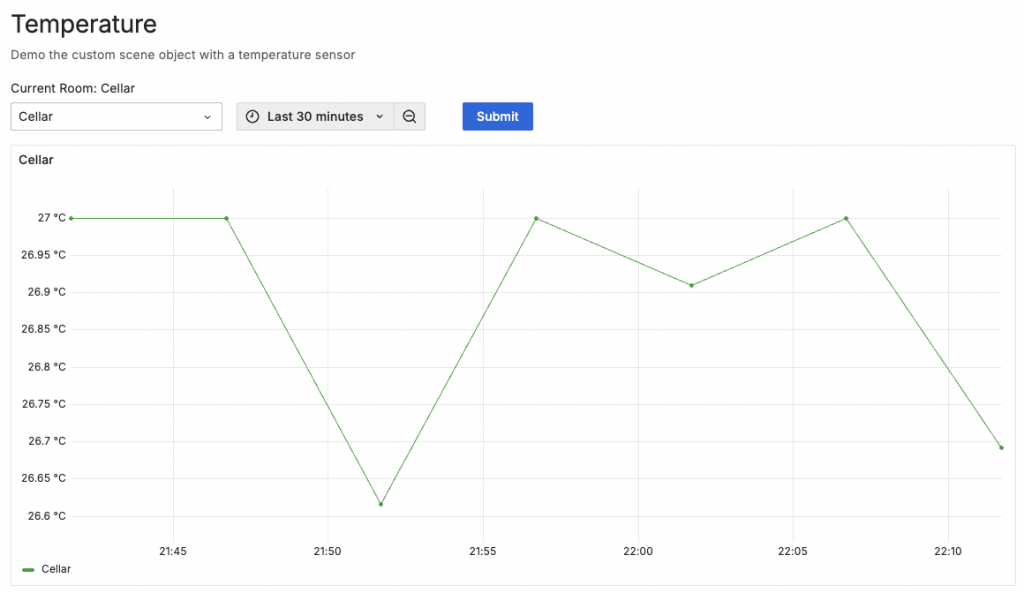
TemperatureByRoomScene 作為這個客製化 Scene 的 body,使用 sceneGraph.getTimeRange 取得時間範圍,並用 sceneGraph.getAncestor 取得指定的 TemperatureScene,接著在其狀態中得到 panelData。
同時 body 所渲染的 Component - panelScene 是透過 getTimeSeriesPanelScene 方法取得,並將 panelData 傳入後,作為 SceneDataNode 的 data 參數。
export class TemperatureByRoomScene extends SceneObjectBase<TemperatureSceneProps> {
  constructor(state: TemperatureSceneProps) {
    super(state);
  }

  static Component = ({ model }: SceneComponentProps<TemperatureByRoomScene>) => {
    const timeRange = sceneGraph.getTimeRange(model).state.value;
    const temperatureScene = sceneGraph.getAncestor(model, TemperatureScene);
    const panelData = temperatureScene.useState().panelData;
    const panelScene = panelData ? getTimeSeriesPanelScene(timeRange, panelData, model) : null;
    const styles = useStyles2(getStyles);

    return <div className={styles.body}>{panelScene && <panelScene.Component model={panelScene} />}</div>;
  };
}
export const getTimeSeriesPanelScene = (timeRange: TimeRange, tsData: DataFrame[], sceneContext: SceneObject) =>
  new EmbeddedScene({
    $data: new SceneDataNode({
      data: {
        series: tsData,
        state: LoadingState.Done,
        timeRange,
      },
    }),
    body: ...,
  });
最後萬事俱備,只欠視覺化呈現的呈現,在本次的範例中由於我們已經有了時間序列的資料,且需要呈現的視覺化並不複雜,因此我們可以使用 PanelBuilder 來建立時間序列面板。然而在一些複雜的視覺化需求下,我們可能需要使用自定義面板,因此也會在段落中簡單介紹自定義面板的實作方式。
在 TemperatureByRoomScene 中,我們使用 PanelBuilder 來建立 time series panel,主要需要設定的內容有數據的單位、標題、以及 Panel 的結構:
°C 為單位。sceneGraph.interpolate 方法來取得變數的值。body: new SceneFlexLayout({
direction: 'column',
children: [
new SceneFlexItem({
height: 500,
body: PanelBuilders.timeseries()
.setUnit('°C')
.setTitle(sceneGraph.interpolate(sceneContext, '$room'))
.build(),
}),
],
}),
在 Grafana Scenes 中,如果你想要完全自定義資料的視覺化呈現方式,有兩種做法:
自己刻一個全新的 SceneObject
這種方式很自由,但就少了 VizPanel 內建的一些功能,像是載入狀態和 Grafana UI 提供的 Panel 框架 - PanelChrome 等。
註冊一個 runtime panel plugin
這種做法可以讓自定義視覺化保有標準 Panel 的外觀,跟其他 Panel 及 Grafana 的 UI 保持視覺的一致性。要實作自定義 Panel Plugin,大致上有這幾個步驟:
import { sceneUtils } from "@grafana/scenes";

const myCustomPanel = new PanelPlugin<CustomVizOptions, CustomVizFieldOptions>(CustomVizPanel).useFieldConfig({
  useCustomConfig: (builder) => {
    builder.addNumberInput({
      path: "numericOption",
      name: "Numeric option",
      description: "A numeric option",
      defaultValue: 1,
    });
  },
});

sceneUtils.registerRuntimePanelPlugin({ pluginId: "my-scene-app-my-custom-viz", plugin: myCustomPanel });

https://grafana.com/docs/grafana/latest/developers/http_api/
https://grafana.com/developers/scenes/visualizations#custom-visualizations
