在投資的世界裡,我們常常不只關心一家公司,而是需要同時追蹤多個標的。比方說,你可能想要同時比較 Tesla、Apple、NVIDIA 最近的股價走勢,或者同時產出一份「綜合投資報告」。
import yfinance as yf
import pandas as pd

# 要追蹤的公司
tickers = ["TSLA", "AAPL", "NVDA"]

# 下載過去 6 個月股價
data = yf.download(tickers, start="2024-01-01", end="2024-08-01")["Close"]

print(data.head())
這裡我們直接丟一個 股票代號清單 給 yfinance,就能一次抓到多家公司股價!
python
import matplotlib.pyplot as plt
from matplotlib import font_manager
# 設定中文字體路徑
font_path = "NotoSerifCJKtc-Regular.otf"
font_prop = font_manager.FontProperties(fname=font_path)
plt.figure(figsize=(12,6))
for ticker in tickers:
plt.plot(data.index, data[ticker], label=ticker)
# 標題與標籤使用中文字體
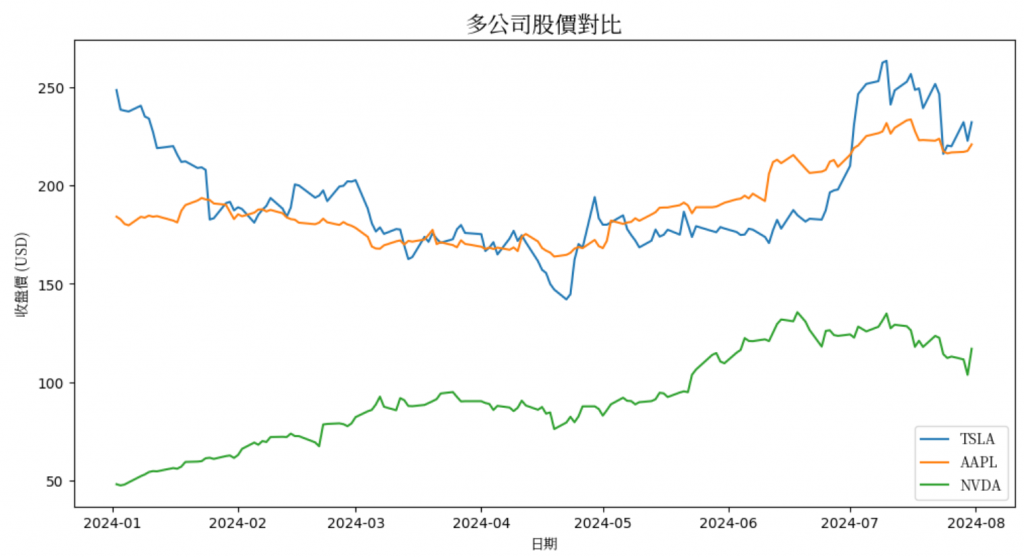
plt.title("多公司股價對比", fontproperties=font_prop, fontsize=16)
plt.xlabel("日期", fontproperties=font_prop)
plt.ylabel("收盤價 (USD)", fontproperties=font_prop)
plt.legend(prop=font_prop) # 圖例也套用中文字體
plt.show()
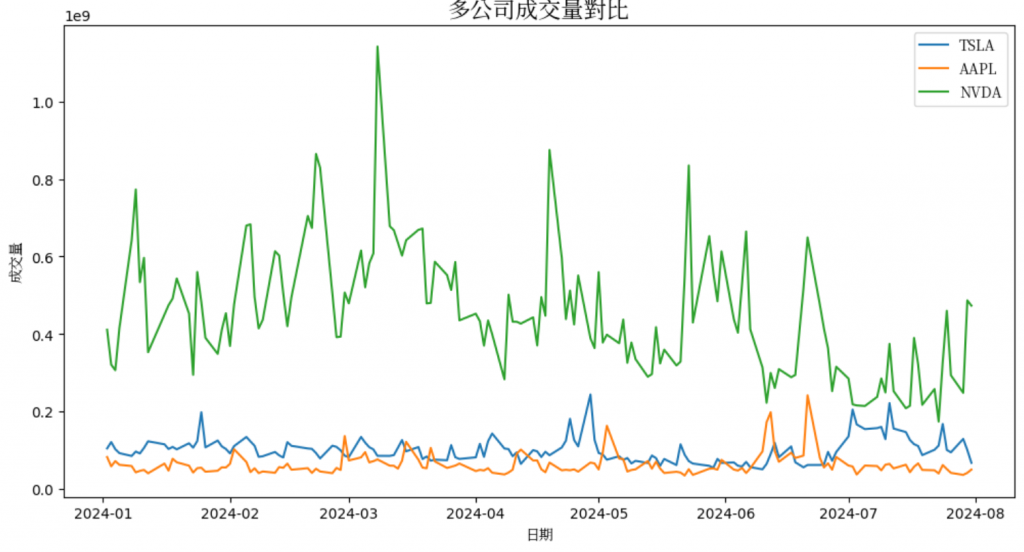
成交量常常代表市場的熱度,我們也可以一起抓出來:
python
import matplotlib.pyplot as plt
from matplotlib import font_manager

# 指定字體 (請把路徑改成你實際存放的地方)
font_path = "NotoSerifCJKtc-Regular.otf"
font_prop = font_manager.FontProperties(fname=font_path)

# 下載成交量資料
volume_data = yf.download(tickers, start="2024-01-01", end="2024-08-01")["Volume"]

plt.figure(figsize=(12,6))
for ticker in tickers:
    plt.plot(volume_data.index, volume_data[ticker], label=ticker)

# 套用中文字體
plt.title("多公司成交量對比", fontproperties=font_prop, fontsize=16)
plt.xlabel("日期", fontproperties=font_prop)
plt.ylabel("成交量", fontproperties=font_prop)
plt.legend(prop=font_prop)  # 圖例也套用字體
plt.show()
我們可以計算各公司漲幅,然後交給 AI 幫忙做文字解釋。
python
# 計算漲幅
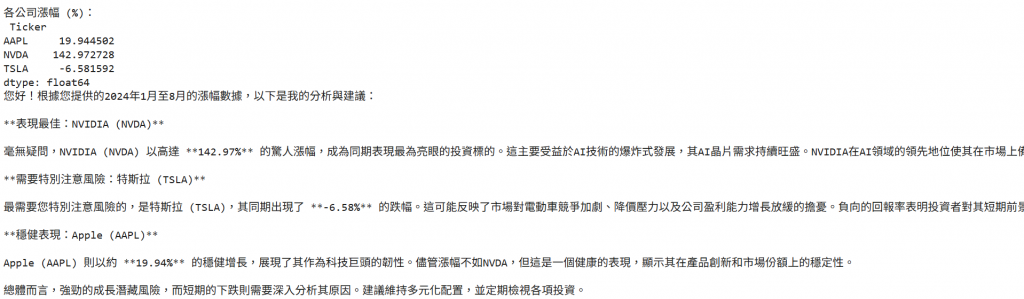
returns = (data.iloc[-1] - data.iloc[0]) / data.iloc[0] * 100
print("各公司漲幅 (%):\n", returns)
# 丟給 AI 總結
import google.generativeai as genai
genai.configure(api_key="YOUR_GEMINI_API_KEY")
model = genai.GenerativeModel("gemini-1.5-flash")
prompt = f"""
以下是三家公司在 2024-01 到 2024-08 的漲幅:
{returns.to_dict()}
請用投資顧問的口吻,分析誰表現最好,誰最需要注意風險,並用 200 字左右說明。
"""
response = model.generate_content(prompt)
print(response.text)
AI 就會自動生成一段「綜合投資分析」,幫助我們快速看懂整體局勢。
延續 Day 16 的做法,我們把圖表、漲幅數據、AI 分析一起輸出成 PDF 報告。
python

from reportlab.pdfgen import canvas
from reportlab.lib.pagesizes import letter
from reportlab.pdfbase import pdfmetrics
from reportlab.pdfbase.cidfonts import UnicodeCIDFont

# 註冊中文字型 (例如:MSung-Light 或 MHei-Medium)
try:
    pdfmetrics.registerFont(UnicodeCIDFont("MSung-Light"))
    chinese_font = "MSung-Light"
except:
    print("MSung-Light not available, trying MHei-Medium")
    try:
        pdfmetrics.registerFont(UnicodeCIDFont("MHei-Medium"))
        chinese_font = "MHei-Medium"
    except:
        print("Neither MSung-Light nor MHei-Medium are available. Please install a CJK CID font compatible with ReportLab.")
        chinese_font = None


def draw_wrapped_text(c, text, x, y, font_name, font_size, max_width, line_height, page_margin=50):
    """在 PDF 中自動換行並處理翻頁"""
    c.setFont(font_name, font_size)
    lines = []
    current_line = ""

    # Split the text into words or characters to handle wrapping
    # For CJK, character by character might be more appropriate
    words = list(text) # Treat each character as a "word" for wrapping

    for word in words:
        # Check if adding the next word/character exceeds the max width
        if c.stringWidth(current_line + word, font_name, font_size) < max_width:
            current_line += word
        else:
            # If it exceeds, add the current line to the list and start a new line with the current word/character
            lines.append(current_line)
            current_line = word

    # Add the last line
    if current_line:
        lines.append(current_line)

    # Draw the lines
    for line in lines:
        if y < page_margin:  # 如果到頁底,自動換頁
            c.showPage()
            c.setFont(font_name, font_size)
            y = letter[1] - page_margin
        c.drawString(x, y, line)
        y -= line_height
    return y


if chinese_font:
    pdf_file = "multi_stock_report.pdf"
    c = canvas.Canvas(pdf_file, pagesize=letter)
    width, height = letter

    # 標題
    c.setFont(chinese_font, 18)
    c.drawString(100, height - 50, "多公司投資報告")

    # 插入數據
    c.setFont(chinese_font, 12)
    y = height - 100

    if 'returns' in globals() and 'response' in globals():
        for company, growth in returns.items():
            c.drawString(100, y, f"{company}: {growth:.2f}%")
            y -= 20

        # AI 分析
        y -= 30
        c.drawString(100, y, "AI 分析:")
        y -= 30

        # 用自動換行函式寫 AI 分析
        y = draw_wrapped_text(
            c,
            response.text,
            x=100,
            y=y,
            font_name=chinese_font,
            font_size=12,
            max_width=width - 200,  # Adjusted max_width to leave more margin
            line_height=18
        )

        c.save()
        print(f"報告已生成:{pdf_file}")
    else:
        print("Required data (returns or response) not found. Please run previous cells.")
else:
    print("Could not find a suitable Chinese font to generate the PDF.")
在這邊因為 canvas.drawString() 不會自動換行,所以長文字會直接超出頁面。所以我在這段程式碼裡直接加上「自動換行」的功能。
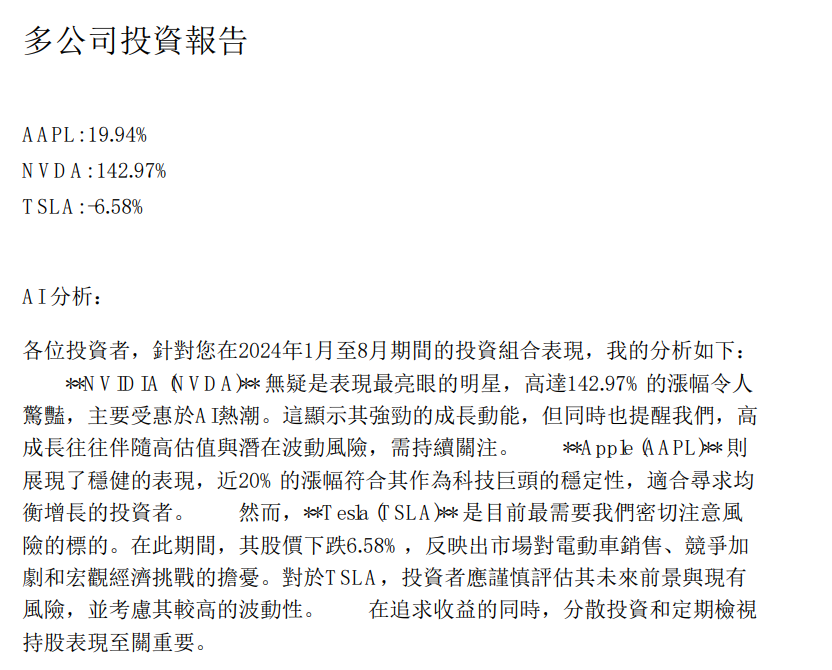
今天我們做到了單次抓取多家公司股價,並繪製收盤價與成交量對比圖,讓我們能快速比較各公司表現。同時,藉由AI自動分析功能,我們深入評估各公司的投資價值,最後只需一鍵就能將所有分析結果輸出成專業的投資報告PDF,徹底實現投資研究的自動化與高效化。
👉 明天(Day 20),我們就要利用 AI + NLP 技術,來幫我們過濾市場雜訊,專注於有用的訊號!


 iThome鐵人賽