昨天我們已經把文章(Markdown)搬進網站,讓「展示館」開始有文字內容。今天要更進一步,把之前做過的 AI 股價分析功能 也搬進來,讓訪客可以直接在網站上體驗。這樣一來,我們的網站不只是文章展示館,而是 互動式 AI 投資 Demo 平台 。
在 pages 或 routes 新增一個 demo.jsx 頁面,並在側邊欄加上「Demo 體驗」選項。
jsx
// src/pages/demo.jsx
import { useState } from "react";
import { Button } from "@/components/ui/button";
export default function DemoPage() {
const [ticker, setTicker] = useState("");
const [result, setResult] = useState("");
const handleAnalyze = async () => {
setResult("分析中,請稍候...");
const res = await fetch("/api/analyze", {
method: "POST",
headers: { "Content-Type": "application/json" },
body: JSON.stringify({ ticker }),
});
const data = await res.json();
setResult(data.message);
};
return (
<div className="p-6">
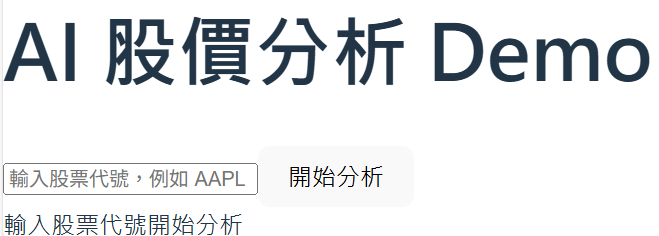
<h1 className="text-2xl font-bold mb-4">AI 股價分析 Demo</h1>
<div className="flex gap-2 mb-4">
<input
className="border p-2 rounded w-60"
type="text"
placeholder="輸入股票代號,例如 AAPL"
value={ticker}
onChange={(e) => setTicker(e.target.value)}
/>
<Button onClick={handleAnalyze}>開始分析</Button>
</div>
<div className="p-4 border rounded bg-gray-50 min-h-[100px]">
{result || "輸入股票代號開始分析"}
</div>
</div>
);
}
這樣網站就會出現一個輸入框和按鈕,可以輸入股票代號並得到分析。
我們需要一個 API route 來處理請求:
用 yfinance 抓股價資料
簡單用 matplotlib 畫趨勢圖
丟給 AI 做解釋
python
# api/analyze.py (FastAPI / Flask 範例)
from fastapi import FastAPI, Request
import yfinance as yf
import matplotlib.pyplot as plt
import io, base64
import google.generativeai as genai

app = FastAPI()
genai.configure(api_key="YOUR_GEMINI_API_KEY")

@app.post("/api/analyze")
async def analyze(request: Request):
    data = await request.json()
    ticker = data["ticker"]

    # 抓取股價
    stock = yf.Ticker(ticker)
    hist = stock.history(period="1mo")

    # 繪製趨勢圖
    plt.figure(figsize=(8, 4))
    plt.plot(hist.index, hist["Close"], label="Close Price")
    plt.legend()
    buf = io.BytesIO()
    plt.savefig(buf, format="png")
    buf.seek(0)
    img_b64 = base64.b64encode(buf.read()).decode("utf-8")

    # 丟給 AI 解釋
    model = genai.GenerativeModel("gemini-1.5-flash")
    prompt = f"以下是 {ticker} 最近一個月的股價走勢:\n{hist.tail(5)}\n請用投資小白也能懂的語言解釋。"
    response = model.generate_content(prompt)

    return {
        "message": response.text,
        "chart": f"data:image/png;base64,{img_b64}"
    }
修改剛剛的 demo.jsx,把 API 回傳的圖片也顯示出來:
jsx
{result && (
  <div className="mt-4">
    <p className="mb-2 font-semibold">AI 分析結果:</p>
    <p>{result}</p>
    {data.chart && (
      <img src={data.chart} alt="股價走勢圖" className="mt-4 border rounded" />
    )}
  </div>
)}
點開 Demo 即可看到輸入框
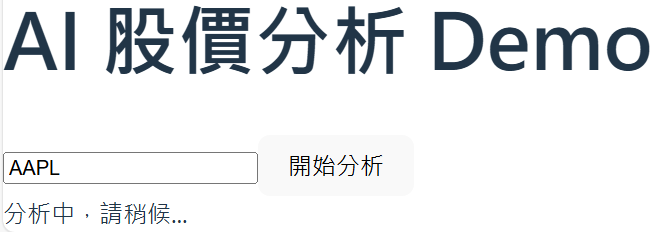
輸入 AAPL 並按下開始分析,就會顯示分析中,請稍後
但在此時遇到了問題,就是疑似連接一直有問題,一直卡在分析中,沒有跑出結果來
為了先行解決這個問題,我先改用 ngrok 來處理這個部分
要先完成 ngrok (https://dashboard.ngrok.com)的帳號註冊
python
from pyngrok import ngrok
ngrok.set_auth_token("你的專屬金鑰") # 請將這段換成你的實際金鑰
python
# 第一步:安裝所需套件
!pip install streamlit yfinance google-generativeai matplotlib pyngrok
# --- 新增:上傳字體與配置 ---
# 你需要手動將 NotoSerifCJKtc-Regular.otf 上傳到 Colab 的文件系統中
# 最簡單的方法是點擊左側的文件夾圖標,然後將字體文件拖曳進去
# 或者執行以下程式碼,它會要求你上傳文件
from google.colab import files
import matplotlib.font_manager as fm
import os
# 上傳字體檔案
# 注意:這會開啟一個上傳框,你需要選擇 NotoSerifCJKtc-Regular.otf
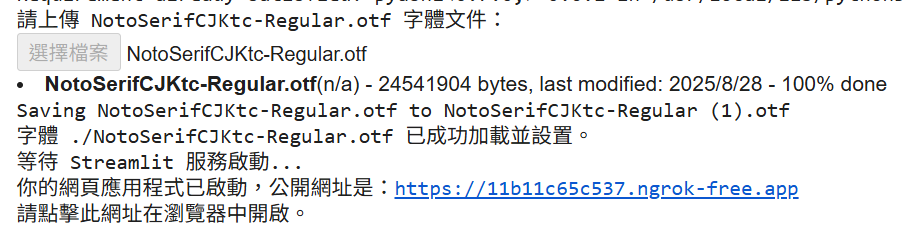
print("請上傳 NotoSerifCJKtc-Regular.otf 字體文件:")
uploaded = files.upload()
font_path = './NotoSerifCJKtc-Regular.otf' # 假設你上傳到根目錄
# 清除 Matplotlib 字體緩存並添加字體
if os.path.exists(font_path):
fm.fontManager.addfont(font_path)
# 設置全局字體為 Noto Serif CJK TC
plt.rcParams['font.family'] = ['Noto Serif CJK TC']
# 確保負號顯示正常
plt.rcParams['axes.unicode_minus'] = False
# 清除 Matplotlib 緩存,確保新字體被識別
!rm -rf ~/.cache/matplotlib
print(f"字體 {font_path} 已成功加載並設置。")
else:
print(f"警告:字體文件 {font_path} 未找到。圖表可能無法正常顯示中文。")
# --- 新增結束 ---
# 第二步:寫入 Streamlit 應用程式碼到檔案
# Streamlit 應用需要一個 .py 檔案來運行
app_code = """
import streamlit as st
import yfinance as yf
import matplotlib.pyplot as plt
import google.generativeai as genai
import os
import matplotlib.font_manager as fm # 新增:導入 font_manager
# --- 新增:字體配置到 Streamlit 應用檔案中 ---
# 確保字體路徑正確。在 Colab 環境中,直接用 './' 應該可以找到
font_path_in_app = './NotoSerifCJKtc-Regular.otf'
if os.path.exists(font_path_in_app):
fm.fontManager.addfont(font_path_in_app)
plt.rcParams['font.family'] = ['Noto Serif CJK TC']
plt.rcParams['axes.unicode_minus'] = False
# 注意:在 Streamlit 應用內部不需要再次清除緩存,因為環境是新的
else:
st.warning(f"警告:Streamlit 應用中字體文件 {font_path_in_app} 未找到。圖表可能無法正常顯示中文。")
# --- 新增結束 ---
# 設定 Google API 金鑰
genai.configure(api_key="YOUR_GEMINI_API_KEY")
st.title("股票趨勢 AI 分析器")
st.write("請輸入股票代碼,讓 AI 幫你分析近一個月的股價走勢。")
ticker = st.text_input("輸入股票代碼 (e.g., AAPL, 2330.TW)", "2330.TW")
if st.button("開始分析"):
if not ticker:
st.error("請輸入有效的股票代碼!")
else:
with st.spinner("正在分析中...請稍候"):
try:
stock = yf.Ticker(ticker)
hist = stock.history(period="1mo")
if hist.empty:
st.error(f"找不到股票代碼:{ticker}。請確認代碼是否正確。")
else:
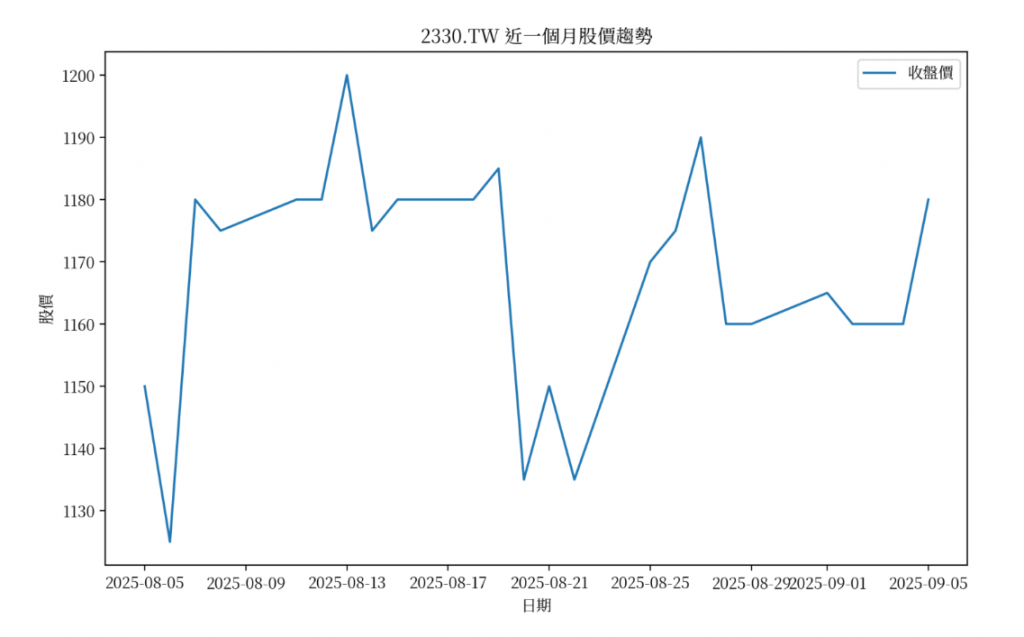
plt.figure(figsize=(10, 6))
# 修改:確保中文標題、圖例、軸標籤都使用設定好的字體
plt.plot(hist.index, hist["Close"], label="收盤價") # 圖例中文
plt.title(f"{ticker} 近一個月股價趨勢") # 標題中文
plt.xlabel("日期") # X軸中文
plt.ylabel("股價") # Y軸中文
plt.legend()
st.pyplot(plt)
plt.close()
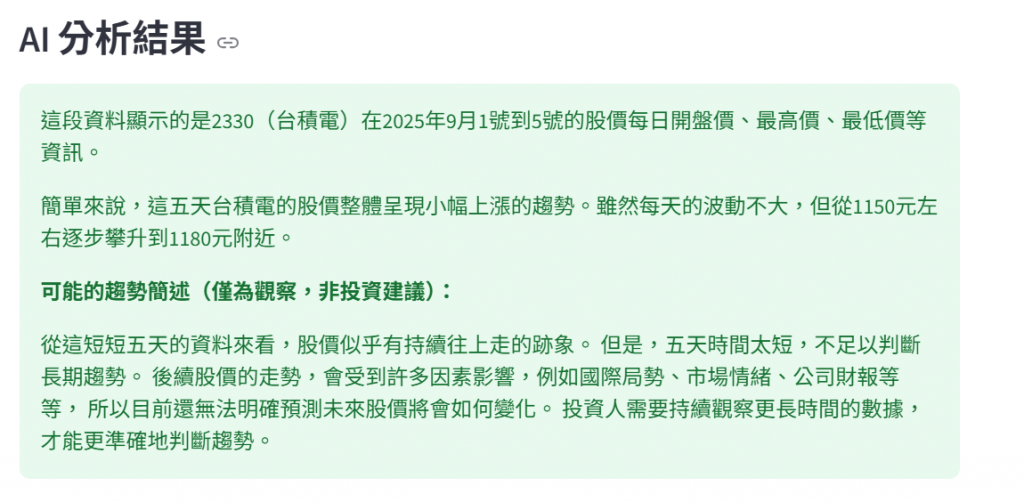
model = genai.GenerativeModel("gemini-1.5-flash")
prompt = f"以下是 {ticker} 最近一個月的股價走勢資料:\\n{hist.tail(5)}\\n\\n請用台灣股市投資新手也能懂的白話文解釋這段時間的股價變化,並簡要說明其可能的趨勢,不需要提供任何投資建議。請用繁體中文回答。"
response = model.generate_content(prompt)
ai_response_text = response.text
st.markdown("### AI 分析結果")
st.success(ai_response_text)
except Exception as e:
st.error(f"發生錯誤:{e}")
"""
with open("app.py", "w") as f:
f.write(app_code)
# 第三步:設定 ngrok 驗證金鑰
# 請將這段換成你的實際金鑰
from pyngrok import ngrok
ngrok.set_auth_token("你的專屬金鑰")
# 第四步:使用 pyngrok 啟動 Streamlit 服務
import subprocess
import threading
import time
def run_streamlit():
"""在背景執行 Streamlit 服務"""
subprocess.run(["streamlit", "run", "app.py"])
# 使用線程來啟動 Streamlit,這樣主程式碼才能繼續執行
streamlit_thread = threading.Thread(target=run_streamlit, daemon=True)
streamlit_thread.start()
# 等待 Streamlit 服務啟動
print("等待 Streamlit 服務啟動...")
time.sleep(5) # 稍微增加等待時間,確保 Streamlit 完全啟動
# 建立 ngrok 隧道
try:
public_url = ngrok.connect(8501).public_url
print(f"你的網頁應用程式已啟動,公開網址是:{public_url}")
print("請點擊此網址在瀏覽器中開啟。")
except Exception as e:
print(f"Ngrok 連線失敗:{e}")
print("請檢查你的 ngrok 驗證金鑰是否設定正確,或 Streamlit 服務是否成功啟動。")
插入完文字檔案後,就可以開啟網站
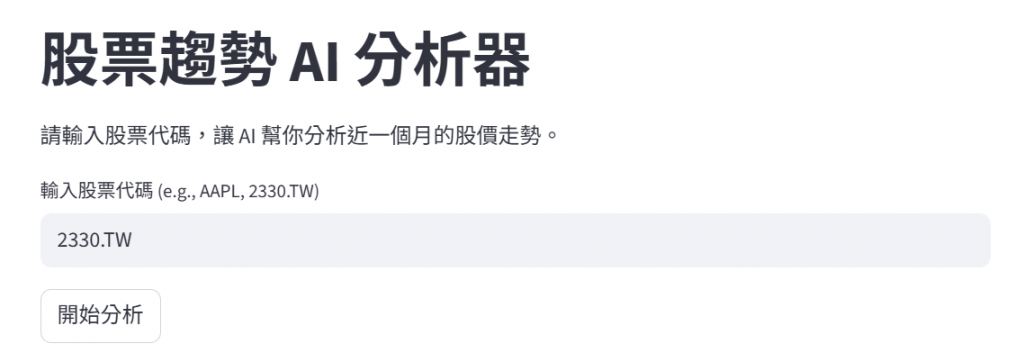
就可以輸入你想查詢的股票代碼,並加以分析
 !
!
https://ithelp.ithome.com.tw/upload/images/20250906/20169444Lams83JQDd.png
雖然未能在原本的網站上成功實作出成果,但經過不斷嘗試與研究後,我們臨時改用 ngrok 建立另一個網站,並順利完成預期的功能。使用者只需輸入股票代號(例如 AAPL),系統即可自動抓取近一個月的股價資料並繪製圖表,接著由 AI 生成自然語言解釋,最終在頁面上同時呈現 股價走勢圖 與 AI 分析說明。未來只要將這些模組進一步串接整合,相信能順利完成完整的網站服務。
👉 明天(Day 24),我們會讓 AI 報告「開口說話」,把股市分析變成語音播報!

