
到目前為止,我們已經有了 /search、中介層、context/timeout 與錯誤策略。今天目標是:
原則:微基準要小、可重現、沒有 I/O。
以我們的搜尋服務為例,最值得量的通常有:
[]SearchResult 的建立方式(預先配置容量 vs 動態 append)。json.Marshal vs json.Encoder、是否重用 buffer。新增基準檔案 bench_search_test.go:
package main

import (
	"bytes"
	"encoding/json"
	"net/http"
	"net/http/httptest"
	"testing"
)

// 偽資料來源
var smallHits = []SearchResult{
	{ID: 1, Title: "Learning Go"},
	{ID: 2, Title: "Go Concurrency Patterns"},
	{ID: 3, Title: "High Performance Go"},
}

// 1A) 動態 append(可能反覆擴容)
func buildHitsAppend(src []SearchResult) []SearchResult {
	out := []SearchResult{}
	for _, h := range src {
		out = append(out, h)
	}
	return out
}

// 1B) 預先配置容量(避免擴容)
func buildHitsPrealloc(src []SearchResult) []SearchResult {
	out := make([]SearchResult, 0, len(src))
	for _, h := range src {
		out = append(out, h)
	}
	return out
}

func BenchmarkBuildHitsAppend(b *testing.B) {
	for i := 0; i < b.N; i++ {
		_ = buildHitsAppend(smallHits)
	}
}

func BenchmarkBuildHitsPrealloc(b *testing.B) {
	for i := 0; i < b.N; i++ {
		_ = buildHitsPrealloc(smallHits)
	}
}
重點:量「相同邏輯不同實作」的成本差異;-benchmem 會顯示配置次數(allocs/op)。
json.Marshal vs json.Encoder(重用 buffer)type respEnvelope struct {
Query string `json:"query"`
Hits []SearchResult `json:"hits"`
}
var resp = respEnvelope{
Query: "golang",
Hits: smallHits,
}
func BenchmarkJSONMarshal(b *testing.B) {
for i := 0; i < b.N; i++ {
_, _ = json.Marshal(resp)
}
}
func BenchmarkJSONEncoder_ReusedBuffer(b *testing.B) {
var buf bytes.Buffer
enc := json.NewEncoder(&buf)
for i := 0; i < b.N; i++ {
buf.Reset()
_ = enc.Encode(resp) // 注意 Encode 會在結尾加 '\n'
}
}
重點:
Marshal 每次都配新切片;Encoder 可重用 buffer。benchmem 看「allocs/op」能不能降。我們可以用 httptest 驗證一條請求經過 mux + middleware 的成本。注意:這仍是微基準,不能引入 time.Sleep 或真正網路。
func BenchmarkHandlerPipeline(b *testing.B) {
	mux := http.NewServeMux()
	mux.HandleFunc("/healthz", healthHandler)
	mux.HandleFunc("/search", func(w http.ResponseWriter, r *http.Request) {
		// 直接回簡單 JSON,避免 I/O 干擾
		_ = json.NewEncoder(w).Encode(resp)
	})
	h := LoggingMiddleware(RecoveryMiddleware(mux))

	req := httptest.NewRequest(http.MethodGet, "/search?q=golang", nil)

	b.ReportAllocs()
	for i := 0; i < b.N; i++ {
		rr := httptest.NewRecorder()
		h.ServeHTTP(rr, req)
		_ = rr.Result().Body.Close()
	}
}
重點:
b.ReportAllocs() 可顯示每次請求分配量。先關掉 CPU 降頻、背景爆量程式,避免干擾數據。基準請在同一台機器上對比。
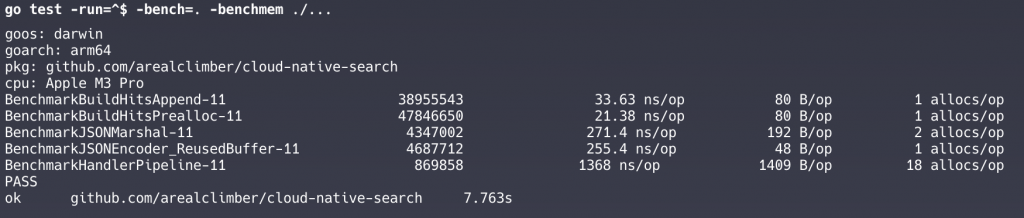
# 只跑基準(不跑測試),並顯示記憶體配置
go test -run=^$ -bench=. -benchmem ./...

# 取三次平均,避免偶發抖動
go test -run=^$ -bench=. -benchmem -count=3 ./...

# ----- 測單一 benchmark -----

# 只跑一次 HandlerPipeline
go test -run=^$ -bench=HandlerPipeline -benchtime=1x

# 至少量到 5 秒
go test -bench=HandlerPipeline -benchmem -benchtime=5s

# 紀錄 benchmark 在未來比對前後差異
go test -bench=HandlerPipeline -benchmem > old.txt
# 修改程式後
go test -bench=HandlerPipeline -benchmem > new.txt

# 根據附錄安裝完 benchstat 即可透過工具解讀數據
benchstat old.txt new.txt

# 跑多次樣本讓 benchstat 算出平均值、標準差、p 值
go test -bench=HandlerPipeline -benchmem -count=10 > old.txt
# 修改程式後
go test -bench=HandlerPipeline -benchmem -count=10 > new.txt
參數意義:
11:在 GOMAXPROCS=11 下跑出的成績(機器/執行緒數相關)數據解讀:
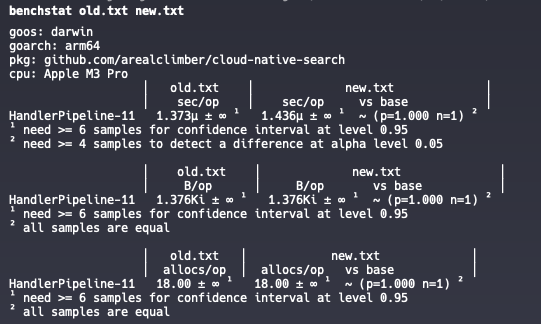
sec/op = 每次操作平均花費的時間。B/op = 每次操作平均配置的記憶體大小(bytes)。allocs/op = 每次操作平均配置次數。1. 執行時間 (sec/op)
HandlerPipeline-11
old: 1.373µs/op
new: 1.436µs/op
差異:~ +4.6%(但 p=1.000, n=1)
意思是新版本平均慢了 ~4.6%,但是 只跑了 1 次樣本 (n=1) → 沒有統計顯著性,benchstat 說需要至少 6 次樣本才有信心。
2. 記憶體配置大小 (B/op)
old: 1.376KiB/op
new: 1.376KiB/op
兩邊完全一樣。配置的 bytes 沒差異。
3. 配置次數 (allocs/op)
old: 18.00 allocs/op
new: 18.00 allocs/op
兩邊完全相同。平均每次 handler 請求大概會產生 18 次配置。
後續怎麼做
benchstat 需要多次樣本(通常至少 6 次)才能做統計檢定,否則它就會標示「all samples are equal」或「need ≥6 samples」。sec/op 持續變大 → 代表 pipeline 整體變慢。B/op 或 allocs/op 下降 → 表示配置優化成功(通常比時間更穩定)。p<0.05 通常可以認為「真的有差」。runtime.KeepAlive(x)。benchmem:同時看 ns/op 與 allocs/op,常常分配才是慢的根源。b.ReportAllocs():對 handler 這種黑箱路徑很有幫助。benchtime 與 cpu:需要時拉長基準時間(例如 benchtime=2s),或試不同 CPU 核數(cpu 1,2,4)。把當下的重要數字貼到 BENCHMARK.md 或 README.md:
go test -run=^$ -bench=. -benchmem -count=3 ./...

goos: darwin
goarch: arm64
pkg: github.com/arealclimber/cloud-native-search
cpu: Apple M3 Pro
BenchmarkBuildHitsAppend-11             	45286250	        24.07 ns/op	      80 B/op	       1 allocs/op
BenchmarkBuildHitsAppend-11             	50686822	        23.28 ns/op	      80 B/op	       1 allocs/op
BenchmarkBuildHitsAppend-11             	49706593	        22.68 ns/op	      80 B/op	       1 allocs/op
BenchmarkBuildHitsPrealloc-11           	65393312	        18.50 ns/op	      80 B/op	       1 allocs/op
BenchmarkBuildHitsPrealloc-11           	65247532	        18.50 ns/op	      80 B/op	       1 allocs/op
BenchmarkBuildHitsPrealloc-11           	65183881	        19.61 ns/op	      80 B/op	       1 allocs/op
BenchmarkJSONMarshal-11                 	 4423723	       256.8 ns/op	     192 B/op	       2 allocs/op
BenchmarkJSONMarshal-11                 	 4818093	       249.5 ns/op	     192 B/op	       2 allocs/op
BenchmarkJSONMarshal-11                 	 4847042	       293.8 ns/op	     192 B/op	       2 allocs/op
BenchmarkJSONEncoder_ReusedBuffer-11    	 4613480	       261.4 ns/op	      48 B/op	       1 allocs/op
BenchmarkJSONEncoder_ReusedBuffer-11    	 4957220	       240.3 ns/op	      48 B/op	       1 allocs/op
BenchmarkJSONEncoder_ReusedBuffer-11    	 4970575	       257.7 ns/op	      48 B/op	       1 allocs/op
BenchmarkHandlerPipeline-11             	  930145	      1223 ns/op	    1409 B/op	      18 allocs/op
BenchmarkHandlerPipeline-11             	 1000000	      1303 ns/op	    1409 B/op	      18 allocs/op
BenchmarkHandlerPipeline-11             	  919501	      1225 ns/op	    1409 B/op	      18 allocs/op
PASS
ok  	github.com/arealclimber/cloud-native-search	20.799s
未來改動專案(例如引入 SearchService、加欄位、換 JSON 套件),重新跑一次,與基線比較。如果大幅變慢,就要審視原因。
今天完成:
go test -bench 與 benchmem 產生可重現的數字
安裝 Go 官方工具用來解讀 benchmark
go install golang.org/x/perf/cmd/benchstat@latest
安裝後可執行檔會放在 $GOPATH/bin 或 $HOME/go/bin。
確保這個路徑有加到你的 $PATH,例如 macOS / Linux 的 zsh,可以在 ~/.zshrc 加上:
export PATH=$PATH:$(go env GOPATH)/bin
確認安裝成功
benchstat -h
*註:(33.63-21.38)/33.63 ≈ 36%
👉 明天,我們要開始處理併發基礎:實作一個「有限併發的 worker pool」,並以簡單壓測觀察「限制併發」對系統穩定度與尾延遲的影響。
