在「健康檢查」一章中,透過/health.json檢查新竹百貨公司的健康狀態。這些健康檢查端點,也可以提供給Uptime Monitor服務--像是UptimeRobot進行檢查。
那麼APISIX本身呢?
如果是使用3.13以後的版本,可以直接使用Status API。如果是此前版本,可以透過promethues或是node-status端點進行檢查。
Status API是在3.13版本後才出現在文檔之中。
如果要將「Quick Start」中的案例調整成3.13版本,可以調整docker-compose.yaml中的apisix服務:
  apisix:
    container_name: apisix
    restart: always
    #image: "apache/apisix:3.2.2-debian"
    image: "apache/apisix:3.13.0-debian"
    volumes:
      - ./apisix_config/config.yaml:/usr/local/apisix/conf/config.yaml:ro
    ports:
      - 9180:9180 # admin api
      - 7085:7085 # Status API
      - 9080:9080 # HTTP
      - 9091:9091 # prometheus
      - 9443:9443 # HTTPS
      - 9090:9090 # control api
      - 389:389 # Proxy AD Service
    environment:
      TZ: "Asia/Taipei"
將使用的image替換成apache/apisix:3.13.0-debian,並且轉發7085端口。然後調整apisix_config/config.yaml:
apisix:
  node_listen: 9080
  enable_ipv6: false

  status:  # Status API
    ip: "0.0.0.0"
    port: 7085
增加apisix.status區段。接著重新創建apisix服務:
docker compose up -d apisix
然後就可以瀏覽 http://localhost:7085/status 。

node-status plugin在此前,也已經示範了如何啟用prometheus plugin。這部份將示範如何啟用node-status plugin。可以在apisix_config/config.yaml添加plugins區段:
plugins:
  # - ...
  - node-status
不過如此添加,會覆蓋掉原本預設(default)的區段內容。我會建議直接將預設值貼上,並找到node-status的plugin,取消其註解:
plugins:                          # plugin list (sorted by priority)
  - real-ip                        # priority: 23000
  - ai                             # priority: 22900
  - client-control                 # priority: 22000
  - proxy-control                  # priority: 21990
  - request-id                     # priority: 12015
  - zipkin                         # priority: 12011
  #- skywalking                    # priority: 12010
  #- opentelemetry                 # priority: 12009
  - ext-plugin-pre-req             # priority: 12000
  - fault-injection                # priority: 11000
  - mocking                        # priority: 10900
  - serverless-pre-function        # priority: 10000
  #- batch-requests                # priority: 4010
  - cors                           # priority: 4000
  - ip-restriction                 # priority: 3000
  - ua-restriction                 # priority: 2999
  - referer-restriction            # priority: 2990
  - csrf                           # priority: 2980
  - uri-blocker                    # priority: 2900
  - request-validation             # priority: 2800
  - openid-connect                 # priority: 2599
  - cas-auth                       # priority: 2597
  - authz-casbin                   # priority: 2560
  - authz-casdoor                  # priority: 2559
  - wolf-rbac                      # priority: 2555
  - ldap-auth                      # priority: 2540
  - hmac-auth                      # priority: 2530
  - basic-auth                     # priority: 2520
  - jwt-auth                       # priority: 2510
  - key-auth                       # priority: 2500
  - consumer-restriction           # priority: 2400
  - forward-auth                   # priority: 2002
  - opa                            # priority: 2001
  - authz-keycloak                 # priority: 2000
  #- error-log-logger              # priority: 1091
  - body-transformer               # priority: 1080
  - proxy-mirror                   # priority: 1010
  - proxy-cache                    # priority: 1009
  - proxy-rewrite                  # priority: 1008
  - workflow                       # priority: 1006
  - api-breaker                    # priority: 1005
  - limit-conn                     # priority: 1003
  - limit-count                    # priority: 1002
  - limit-req                      # priority: 1001
  #- node-status                   # priority: 1000
  - gzip                           # priority: 995
  - server-info                    # priority: 990
  - traffic-split                  # priority: 966
  - redirect                       # priority: 900
  - response-rewrite               # priority: 899
  - degraphql                      # priority: 509
  - kafka-proxy                    # priority: 508
  #- dubbo-proxy                   # priority: 507
  - grpc-transcode                 # priority: 506
  - grpc-web                       # priority: 505
  - public-api                     # priority: 501
  - prometheus                     # priority: 500
  - datadog                        # priority: 495
  - elasticsearch-logger           # priority: 413
  - echo                           # priority: 412
  - loggly                         # priority: 411
  - http-logger                    # priority: 410
  - splunk-hec-logging             # priority: 409
  - skywalking-logger              # priority: 408
  - google-cloud-logging           # priority: 407
  - sls-logger                     # priority: 406
  - tcp-logger                     # priority: 405
  - kafka-logger                   # priority: 403
  - rocketmq-logger                # priority: 402
  - syslog                         # priority: 401
  - udp-logger                     # priority: 400
  - file-logger                    # priority: 399
  - clickhouse-logger              # priority: 398
  - tencent-cloud-cls              # priority: 397
  - inspect                        # priority: 200
  #- log-rotate                    # priority: 100
  # <- recommend to use priority (0, 100) for your custom plugins
  - example-plugin                 # priority: 0
  #- gm                            # priority: -43
  - aws-lambda                     # priority: -1899
  - azure-functions                # priority: -1900
  - openwhisk                      # priority: -1901
  - openfunction                   # priority: -1902
  - serverless-post-function       # priority: -2000
  - ext-plugin-post-req            # priority: -3000
  - ext-plugin-post-resp           # priority: -4000
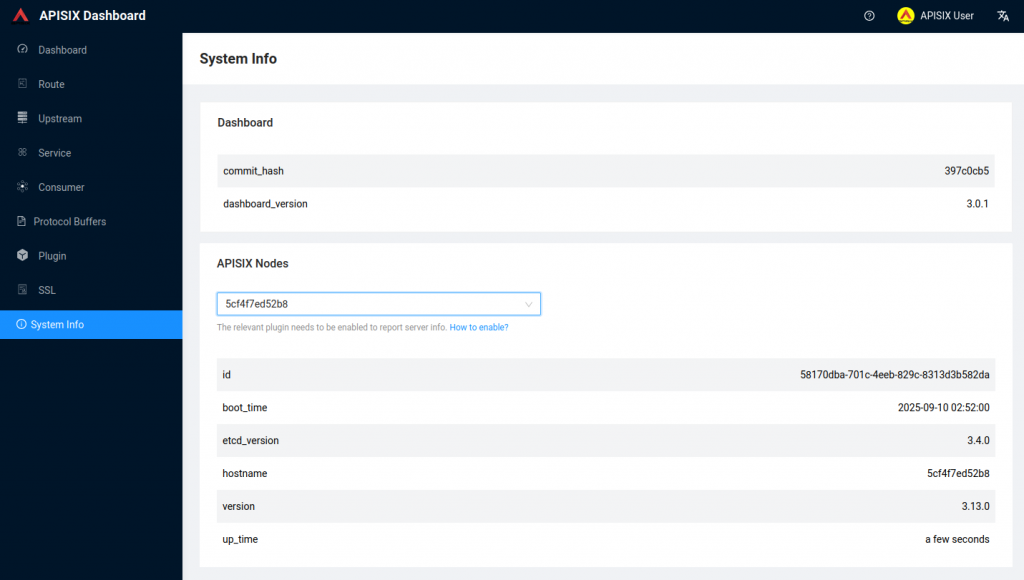
留意public-api和server-info也是啟用的(server-info非必要)。這樣一來,可以在Dashboard看到節點狀態。
警告
server-info插件已棄用,將在未來的版本中移除。更多關於棄用和移除計劃的信息,請參考 這個討論。
curl http://127.0.0.1:9180/apisix/admin/routes/ns -H 'X-API-KEY: SaiTJp7TEa9K39oy7D5A4ouXmdqHvL9a' -X PUT -d '
{
    "uri": "/apisix/status",
    "plugins": {
        "public-api": {}
    }
}'

同樣的就可以瀏覽 http://localhost:9080/apisix/status 。
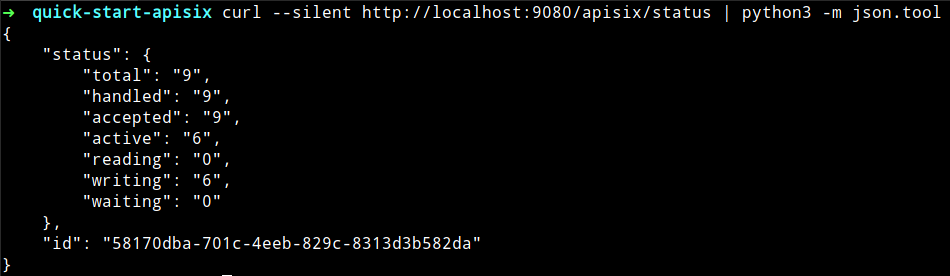
呈現的資訊如下,這個端點也可以作為APISIX自身的健康檢查端點:
| 參數 | 說明 |
|---|---|
| status | APISIX 的狀態資訊。 |
| total | 用戶端請求總數。 |
| waiting | 當前等待用戶端請求的閒置連線數。 |
| accepted | 當前已經接受的用戶端連線總數。 |
| writing | 當前正在寫給用戶端回應的連線數。 |
| handled | 當前已經處理的連線總數,除非達到其他資源的限制,否則此值與 accepted 相同。 |
| active | 當前活躍的用戶端連線數。 |
| reading | 當前正在讀取請求標頭的連線數。 |
| id | APISIX UID 資訊,保存在 ./conf/apisix.uid 檔案中。 |