

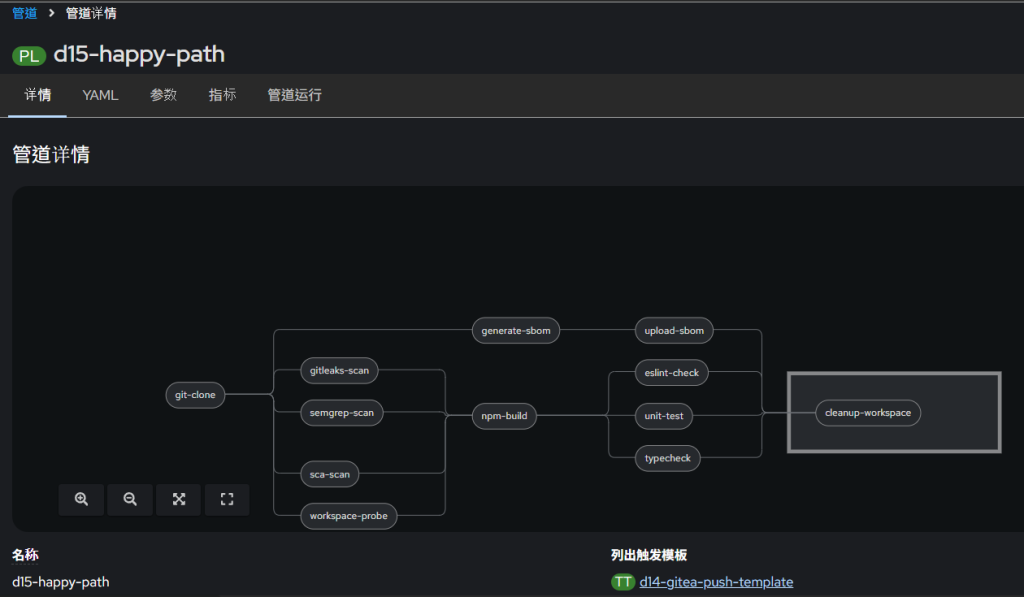
一口氣多了不少TASK(汗)
環境:單節點 CRC 4.21.14 / Nx 23.1.1 / TypeScript 6.0.3 / Angular 22 / 只有
apps/web一個專案。
數字全部是 2026-08-22 在cinamespace 跑出來的。
更完整的量測留底見紀錄-Day23-四個Task的量測留底.md。
原本的 npm-build 拆成 npm-install + nx-build,typecheck 插在中間。
DAG 從 8 個 Task 變成 12 個 + 1 個 finally。
| Task | 掛在哪 | 耗時 | 為什麼要有 |
|---|---|---|---|
typecheck |
npm-install 後、nx-build 前 |
11s | 測試檔的型別沒有任何關卡在看。 build 不編 spec、jest 走 transpile、lint 不管型別 |
generate-sbom |
git-clone 後 |
18s | 記下這次裝了哪 1257 個套件。不需要 node_modules,跟四個掃描並行 |
upload-sbom |
generate-sbom 後 |
7s | 留在 workspace 的檔案下一輪就被刪了。沒存出去的 SBOM 等於沒產出 |
cleanup-workspace |
finally |
11s | 這個不在原本計畫裡,是被逼出來的 |
critical path 固定變長 11 秒。換到的是:型別錯的那次,nx-build 完全不用起跑。
這台觀測到 nx build 落在 21~488 秒之間。
git-clone ──┬─► workspace-probe ─┐
            ├─► gitleaks-scan ───┤
            ├─► semgrep-scan ────┤
            ├─► sca-scan ────────┼─► npm-install ─► typecheck ─► nx-build ─┬─► eslint-check
            │                    │                                         └─► unit-test
            └─► generate-sbom ───┘
                    │
                    └────────────────────────────────────────────────► upload-sbom

finally: cleanup-workspace
一次實跑(整條 11m41s):
typecheck          11s   ← 卡在 critical path
nx-build          488s   ← 一個人佔掉七成
generate-sbom      18s   ─┐ 躲在掃描的並行段裡
upload-sbom         7s   ─┘
cleanup-workspace  11s   (finally)
前提是這台的資源狀況:memory requests 88%,餘裕約 1.5 GiB。
跑一顆量測 Pod 就會讓 API server 出現 TLS handshake timeout。
| 工作 | 峰值 RSS |
|---|---|
typecheck / generate-sbom |
213 MB |
unit-test |
1441~1722 MB |
nx build |
2025 MB(Node 預設 heap 上限 2096 MB) |
四個決定:
typecheck 放在 nx-build 前面。 這需要把 npm-build(npm ci + nx buildnpm-install 是 38 秒,跟拆之前的 npm ci 基準typecheck 不當成 nx-build 的 step。 Kubernetes 算 Pod 的 requests/limits 是把所有nx build 的 2025 MB 已經頂在上限。拆成獨立 Task,兩邊各自 213 MB。generate-sbom 不排在 npm-install 後面。 它只讀 package-lock.json,node_modules 的乾淨 clone 上一樣產出 1257 components。Pending。| 之前(typecheck 並行) | 之後(串接) | |
|---|---|---|
| 固定成本 | 0 | +11 秒(含 pod 啟動,不只 tsc 的 4 秒) |
| 型別錯時省下 | 0 | 整段 nx-build,21~488 秒 |
| 型別錯時看得到什麼 | 四道關卡的結果都有 | 只有型別這一個,其餘全被跳過 |
最後一列是真的損失。拿診斷資訊換速度。
在 nx build 要跑 4~8 分鐘的機器上划算;build 只有 30 秒的話不划算,維持並行比較好。
typecheck同一個型別錯誤放在不同位置,五道檢查各自的反應:
| 錯誤在哪 | app.json |
spec.json |
nx build |
nx test |
nx lint |
|---|---|---|---|---|---|
app.ts(被 spec import) |
抓到 | 抓到 | 抓到 | 漏掉 | 漏掉 |
app.routes.ts(沒被 spec import) |
抓到 | 漏掉 | 抓到 | — | — |
| 孤兒檔(沒人 import) | 抓到 | 漏掉 | 抓到 | — | — |
*.spec.ts |
漏掉 | 抓到 | 漏掉 | 漏掉 | 漏掉 |
看第 4 列:spec 檔的型別,五道裡只有 spec.json 看得見。tsconfig.app.json 明確 exclude 掉 *.spec.ts,nx build 走的也是 app 這條線,jest-preset-angular 走 transpile 不做完整型別檢查。
測試檔正是 mock 和 fixture 住的地方——一份沒被型別檢查的測試,
驗的是你手寫的那個形狀,不是產品程式碼真正的形狀。
⚠️ 這個設定檔從專案建立那天起就沒被任何關卡碰過,所以關卡一開就是紅的
(moduleResolution: node10已被 TypeScript 6 標為 deprecated,改成bundler才過)。
導入新關卡要把這段時間算進預算,寫完 YAML 不是結束。
那次除錯的完整過程在紀錄 §二。
steps:
  - name: typecheck
    image: nexus-nexus-proxy.apps-crc.testing/docker-proxy/library/node:22-alpine
    workingDir: $(workspaces.source.path)
    script: |
      #!/bin/sh
      set -e
      test -d node_modules || { echo "沒有 node_modules,npm-install 沒跑過"; exit 1; }

      TSC=node_modules/.bin/tsc
      FAILED=0
      for TSCONFIG in \
        $(params.APP_DIR)/tsconfig.app.json \
        $(params.APP_DIR)/tsconfig.spec.json; do
        echo "--- $TSCONFIG"
        if $TSC --noEmit -p "$TSCONFIG"; then echo "OK"; else echo "FAILED"; FAILED=1; fi
      done

      [ $FAILED -eq 0 ] || { echo "TypeScript type check failed"; exit 1; }
三個細節:
node_modules/.bin/tsc 精確路徑。 alpine 容器裡 tsc 不在 $PATH,npx tsc 的解析行為也不保證一致。FAILED=1 累積。 兩個 tsconfig 跑完再統一失敗,一次看到全貌。tsconfig.json。
apps/web/tsconfig.json        →  檢查了 0 個檔案
apps/web/tsconfig.app.json    →  10 個
apps/web/tsconfig.spec.json   →  6 個
tsconfig.json 是 solution-style(files: []、include: []、只有 references)。tsc --noEmit -p 它會 exit 0,但什麼都沒檢查。跟 Day 22 那幾個陷阱同一族。
generate-sbom + upload-sbom--package-lock-only 只讀 package-lock.json。實測:
有 node_modules:    1257 components,3 秒
沒有 node_modules:  1257 components,4 秒
一樣。所以掛在 git-clone 後面,跟掃描並行,對 critical path 的貢獻是 0。
① 鎖版本
npm install -g "@cyclonedx/cyclonedx-npm@$(params.CYCLONEDX_VERSION)" --prefer-offline --quiet
不鎖的話同一份 YAML 在不同時間裝到不同版本。SBOM 的產生器版本本身就是供應鏈資訊。
② 用 Tekton result 傳檔名
檔名如果在兩個 Task 各拼一次(sbom-$(git-revision).json),改了一邊沒改另一邊,
Tekton 不會報錯,只會在執行期走進「檔案不存在」那條分支。
  results:
    - name: sbom-file
    - name: component-count
  - name: upload-sbom
    params:
      - name: SBOM_FILE
        value: $(tasks.generate-sbom.results.sbom-file)
實跑:component-count "1257" / sbom-file sbom-7d9158a.json。
component 數順便當 result,PipelineRun 上直接看得到。
③ 找不到檔案 exit 1,不是 exit 0
警告後放行的話,那條分支的語意是不對稱的:
| 情況 | 行為 | Pipeline |
|---|---|---|
| 找不到 SBOM | exit 0 |
全綠 |
| 上傳失敗 | exit 1 |
擋下 |
SBOM 缺一份、Pipeline 全綠,要等到真的要盤點某個 CVE 影響範圍時,
才會發現那次建構的成分表從來沒存在過。
不要沿用 Day 20 建的 semgrep-rules,保存語意相反:
| Semgrep 規則快照 | 每天被覆蓋成最新版 |
| SBOM | 每次建構各留一份,只增不減 |
另開一組,權限只涵蓋 sbom-raw:
repo   sbom-raw               raw hosted
role   sbom-raw-writer        browse / read / add / edit
user   sbom-writer
secret sbom-writer-credentials(ci namespace)
上傳用 node:22-alpine 的內建 fetch,不另外拉 curl 映像——那個映像全線都在用、
已經在節點上了。
cleanup-workspacefinally共用 PVC 上累積的東西:
785 MB / 53067 個檔案(node_modules 佔 774.9 MB)
git-clone 內建的清理用 rm -rfv,-v 把刪掉的每個 path 印一行——
實測它的 pod log 5.2 MB / 60594 行(對照:npm-build 的 log 只有 5.7 KB)。
而且清理失敗被 || true 吞掉,接著噴出 cannot copy ... pre-push.sample: File exists,
看起來像 git 壞了,實際是上一步沒清乾淨。
放 finally 不放 tasks。 runAfter 在前面紅燈時不會跑,
而 workspace 最需要被清的時候正好就是失敗那次。
⚠️ 但
finally會不會跑,取決於你設了哪個 timeout,跟版本。
timeouts.pipeline到期 →「any running child TaskRuns will be canceled,
regardless of whether they are normal Tasks orfinallyTasks」;timeouts.tasks到期 →「finally Tasks will run iftimeouts.finallyis specified」。這台只設了
timeouts: {pipeline: 20m}——整條逾時的時候cleanup-workspace一樣會被砍掉。
要讓它活下來得同時設timeouts.tasks和timeouts.finally。而走那條路還有一個版本問題:
timeouts.tasks到期時finally被跳過是個 bug
(tektoncd/pipeline #6794),Tekton Pipelines v1.13.0 才修。
這台是 v1.12.2(OpenShift Pipelines operator 1.23.1),在修正之前。
finally:
- name: cleanup-workspace
  taskRef:
    kind: Task
    name: cleanup-workspace
  workspaces:
  - name: source
    workspace: shared-workspace
#!/bin/sh
# 刻意不用 set -e:清理失敗不該把整條 pipeline 變紅
echo "=== 清理前 ==="
du -sh . ; echo "檔案數 = $(find . -type f | wc -l)"

for D in node_modules .nx .angular dist coverage; do
  [ -e "$D" ] || continue
  SIZE=$(du -sh "$D" | cut -f1)
  rm -rf "$D" && echo "已刪除 $D($SIZE)" || echo "刪除 $D 失敗"
done

echo "=== 清理後 ==="
du -sh . ; echo "檔案數 = $(find . -type f | wc -l)"
exit 0
不用 rm -rfv。 -v 正是上面那 5.2 MB log 的來源,這裡只印摘要。
效果(同一顆 PVC 連跑兩輪):
git-clone 的 pod log   5448035 bytes  →  6705 bytes
刪掉的 path 數           60594        →  89
編排
generate-sbom 掛 git-clone 後,不是 npm-install 後typecheck 夾在 npm-install 和 nx-build 中間,是獨立 Task 不是 stepcleanup-workspace 放 finally,不是 runAfter
finally 在逾時後仍跑完,要同時設 timeouts.tasks 和 timeouts.finally,typecheck
node_modules/.bin/tsc 精確路徑FAILED=1 累積tsconfig.json
SBOM
cyclonedx-npm 鎖版本exit 1
cleanup
rm -rfv
set -e,清理失敗不該讓 pipeline 變紅綠燈:13 個 TaskRun 全部 Succeeded,sbom-7d9158a.json(2752214 bytes)上傳 Nexus 回 HTTP 201。
紅燈:在 spec 檔放一個執行期正常、只有型別錯的測試:
const result: number = formatDisplayName('ada'); // 回傳 string
typecheck    False   StepFailed     ← 只有它
unit-test    True    Succeeded      Tests: 4 passed
nx-build     True    Succeeded
「測試全過但型別是壞的」 ——這正是這道關卡唯一獨佔的守備範圍。
⚠️ 這次紅燈量於重排之前。改成串接之後,同樣的錯誤只會顯示 typecheck 紅、
後面全部 skipped——就是 §1.2 講的那個損失。
完整輸出見紀錄 §八。
四個新 Task 加起來 47 秒,真正動到 critical path 的只有 typecheck 那 11 秒。
那 11 秒是刻意付的。 換到的是型別錯的那次 nx-build 不用起跑,
代價是那次 run 只看得到型別這一項。build 慢的機器划算,build 快的機器不划算。
真正花掉時間的是兩件計畫外的事:tsconfig.spec.json 從專案建立那天起就沒被檢查過,
所以關卡一開就是紅的;共用 PVC 累積的 53067 個檔案讓 git-clone 的 log 膨脹到 5.2 MB。
Day 24 進入映像檔封裝:Rootless Buildah,以及儲存驅動的設定限制。
參考文件
Tekton
Finally to the Pipeline ——finally「guaranteed to be executed ... regardless of success or error」,§4.1 的依據timeouts.pipeline / tasks / finally 三個欄位語意不同TypeScript
tsc will not automatically build--build switch」。用 -p 指 solution 檔會 exit 0CycloneDX
--package-lock-only:「Whether to only use the lock file, ignoring "node_modules"」,node_modules 都是 1257」的原因Nexus
/repository/<repo-name>/<file-path>,上傳是一個 HTTP PUT,upload-sbom 用內建 fetch 就能做完2026-08-22 在
cinamespace 跑出來的。
這些內容原本在文章正文,移出來的理由是讀者不需要它們也做得到那四步。
文章是路徑,這裡是證據。
看第 1~3 列:app.json 抓得到的,nx build 全都抓得到。 涵蓋範圍上那半是重複的。
但重複不等於沒用——重排之後,app.json 那半的價值從「多防一點」變成「早一點」:app.ts 的型別錯在第 11 秒被攔下,nx-build 那 488 秒完全不用起跑。附帶好處是錯誤訊息乾淨很多,typecheck 的 log 只有 252 bytes,npm-install 的有 5683 bytes(npm ci 的輸出混在裡面)。
看第 4 列:spec 檔的型別,五道裡只有 spec.json 看得見。 tsconfig.app.json 明確 exclude 掉 *.spec.ts,nx build 走的也是 app 這條線,jest-preset-angular 走 transpile 不做完整型別檢查。
spec.json 實際編 6 個檔案,其中只有 3 個是別人不看的:
| 檔案 | 怎麼進來的 | 別人有在看嗎 |
|---|---|---|
src/test-setup.ts |
files |
沒有 |
src/app/app.spec.ts |
include |
沒有 |
src/app/format-utils.spec.ts |
include |
沒有 |
src/app/app.ts |
被 spec import | nx build 也看 |
src/app/nx-welcome.ts |
被 spec import | nx build 也看 |
src/app/format-utils.ts |
被 spec import | nx build 也看 |
那 3 個檔案就是這道關卡唯一獨佔的守備範圍。聽起來很少,但測試檔正是 mock 和 fixture 住的地方——一份沒被型別檢查的測試,驗的是你手寫的那個形狀,不是產品程式碼真正的形狀。
順帶一提,
spec.json的include裡有一項"jest.config.ts"是死的——這個 repo 的檔名是jest.config.cts,一個檔案都沒 match 到。
typecheck 寫好,還沒接進 DAG 就先在本機跑了一次:
apps/web/tsconfig.spec.json(11,25): error TS5107: Option 'moduleResolution=node10' is
  deprecated and will stop functioning in TypeScript 7.0.
照它建議加 "ignoreDeprecations": "6.0",換成兩個新錯:
app.spec.ts(1,25): error TS2307: Cannot find module '@angular/core/testing'
test-setup.ts(4,3): error TS2353: 'errorOnUnknownElements' does not exist in type 'SetupOptions'
第二個很容易讓人以為 Angular 22 拿掉了那個 API。翻 .d.ts:
node_modules/@angular/core/types/testing.d.ts:330: errorOnUnknownElements?: boolean;
它好好的在那裡。TS2353 是 node10 解析不到正確 .d.ts 的症狀,跟 TS2307 同一個根因。
實測六種改法,只有兩種過:moduleResolution: "bundler",或整行拿掉繼承 tsconfig.base.json(它本來就是 bundler)。node16 / nodenext 還要一起改 module。
  // apps/web/tsconfig.spec.json
-   "moduleResolution": "node10"
+   "moduleResolution": "bundler"
改完 nx test / nx build / nx lint 都不受影響。
這個設定檔從專案建立那天起就沒被任何關卡碰過。 build 不看 spec 這條線、jest 走 transpile、lint 不管型別。所以它壞了多久沒人知道。
導入新關卡要把這段時間算進預算,寫完 YAML 不是結束。
--ignore-npm-errors 到底要不要(原 §4.3)官方文件給這個旗標的理由很窄——「npm install 跑過 --force 或 --legacy-peer-deps」,
沒有提到 npm ls 的 exit code 或版本衝突。
而這台連那個窄理由都不成立:
$ npm ls --json --long --all --package-lock-only
exit=0,stderr 空的
留著是為了將來 npm ls 一有抱怨時不要整個 Task 掛掉。註解要寫實話,不要假裝踩過沒踩過的坑。
有一次 webhook 觸發的 run 掛了,REASON 是 PipelineRunTimeout,unit-test 是 TaskRunCancelled。
我第一眼的判斷是「git-clone 花了 9m46s」——那是錯的。oc get taskrun 的 STARTTIME 和 COMPLETIONTIME 兩欄都是「距今多久」,要相減才是耗時。
用時間戳重算:
  npm-build         455s   Succeeded        ← 真正吃掉時間的
  unit-test          71s   TaskRunCancelled
  eslint-check       70s   TaskRunCancelled
  git-clone          25s   Succeeded        ← 一點都不慢
npm-build 一個人吃掉 455 秒,10 分鐘的 timeouts.pipeline 見底,後面兩個被連坐取消。
TaskRunCancelled不代表那道關卡擋了東西,代表它根本沒跑完。StepFailed才是真的失敗。
同一顆共用 PVC 連跑兩輪(run A 開始時是髒的,run B 開始時是乾淨的):
| run A | run B | |
|---|---|---|
git-clone 的 pod log |
5448035 bytes | 6705 bytes |
| 刪掉的 path 數 | 60594 | 89 |
git-clone 耗時 |
25s | 9s |
npm-build 耗時 |
365s | 229s |
| 整條 | 8m05s | 5m40s |
cleanup-workspace 的 log:
=== 清理前 ===
787.5M  .
檔案數 = 53068
已刪除 node_modules(774.9M)
已刪除 .nx(4.4M)
已刪除 .angular(1.9M)
已刪除 dist(2.2M)
=== 清理後 ===
4.1M    .
檔案數 = 68
這裡沒有多花的成本。 git-clone 的 DELETE_EXISTING 預設就是 true,本來每次就會把 node_modules 刪光,npm ci 本來就每次重裝。這只是把刪除從「下一輪的開頭」搬到「這一輪的結尾」。
git-clone 那兩欄是確定的:60594 → 89 個 path 不受叢集負載影響。
npm-build 的 365s → 229s 只有各一次樣本。這台的 npm-build 本來就在 253~455s 之間跳,229s 雖然低於先前所有觀測值,但單一樣本不足以宣稱 −37%。方向對,倍數不對。
229s 也仍然遠高於全新 volumeClaimTemplate PVC 的 61s。清理有幫助,沒有把差距補平。
| 現象 | 說明 |
|---|---|
oc 頻繁 TLS handshake timeout |
requests 88% / 92 個 running pod。nx-build 一跑起來 API server 就抖。建立物件要寫重試 |
MutatingAdmissionWebhook failed to complete mutation in 13s |
同一個成因,oc create 重試一次通常就過 |
| 讀 TaskRun 耗時 | STARTTIME / COMPLETIONTIME 兩欄都是「距今多久」。要用 .status.startTime / .status.completionTime 相減 |
| 測試時不要輪詢 | 每 20 秒一次 oc get 會讓已經吃緊的 API server 更糟。用 oc wait --for=jsonpath='{.status.completionTime}',單一 watch |
在 spec 檔放一個執行期完全正常、只有型別錯的測試:
it('型別錯誤,但測試會過', () => {
  const result: number = formatDisplayName('ada');   // 回傳 string
  expect(result).toBe('ADA');
});
push 之後 webhook 自動觸發:
Tasks Completed: 11 (Failed: 1, Cancelled 0), Skipped: 0

npm-build       True    Succeeded
eslint-check    True    Succeeded
unit-test       True    Succeeded
typecheck       False   StepFailed     ← 只有它
這次紅燈量於重排之前,所以四道關卡的結果都看得到。
改成typecheck → nx-build串接之後,同樣的錯誤只會顯示 typecheck 紅、nx-build/eslint-check/unit-test全部 skipped——這就是第一節「重排的代價」那一列講的損失。
typecheck:
--- apps/web/tsconfig.app.json
OK
--- apps/web/tsconfig.spec.json
format-utils.spec.ts(18,11): error TS2322: Type 'string' is not assignable to type 'number'.
FAILED
同一次 run 的 unit-test:
Test Suites: 2 passed, 2 total
Tests:       4 passed, 4 total
NX   Successfully ran target test for project web
測試全過、build 過、lint 過,型別是壞的。 四道關卡只有一道看得到。
Day 22 是「測試全過,但覆蓋率退步」。這篇是它的鏡像。


 iThome鐵人賽
 看影片追技術