

500 個 Component 都在頁面上,但資料改變時,它們真的都需要一起工作嗎?
如果說 Reactive Chain 看的是資料怎麼傳,那 Component Storm 要看的是 當資料改變之後,Component Tree 到底有多少工作需要被處理?
在大型後台很常見一個 Parent 底下可能掛著數百,甚至上千個結構相似的 Child:
Parent
 ├─ Child
 ├─ Child
 ├─ Child
 ├─ ...
 └─ Child × N
表格列、卡片、表單欄位都可能形成這種結構,因此,Component Storm 除了關心 Vue 能不能更新,最重要的是先把問題拆成兩個可以量測的方向:
今天先用 Vue 3.5.40 建立 Baseline,明天再用完全相同的 Scenario 對比 Vue 3.6。
Component Storm 固定 Parent / Child 的結構,Child 使用相同的 Template、Props 結構與 Reactive Logic,如下圖所示,真正改變的只有兩個實驗維度 Component Count 和 Update Scope。
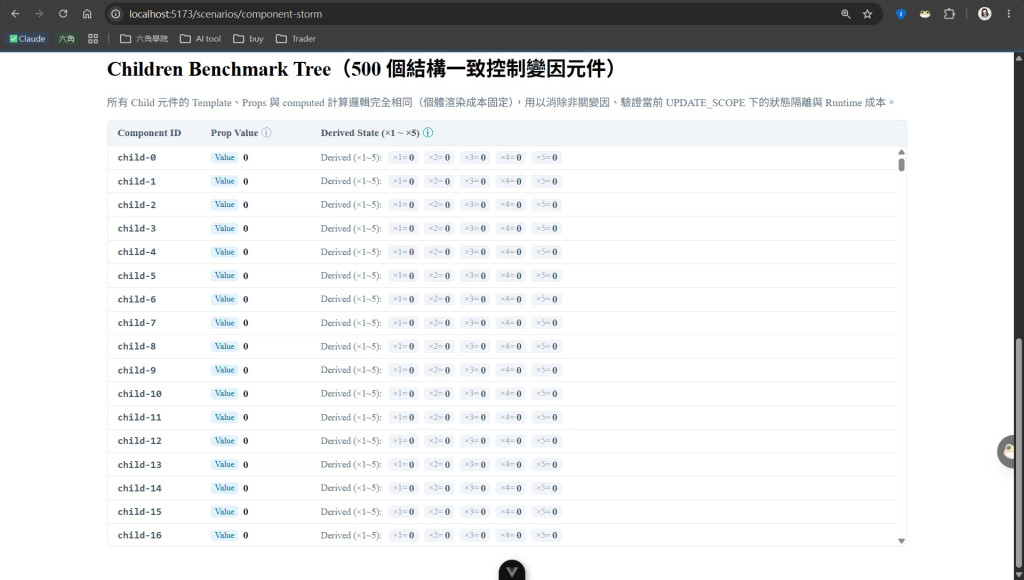
這樣做的目的,是避免最後看到一個數字變化,卻不知道到底是 Component 數量造成的,還是 Update 範圍造成的,三種 Update Scope 分別代表:
只修改 Parent 自己的 State,不修改 Child Props。
Parent ✓
 ├─ Child ✗
 ├─ Child ✗
 ├─ Child ✗
 └─ Child ✗
要回答的是:
Child 沒有改變時,Component Tree 的規模本身會產生多少 Update Cost?
只修改其中一個 Child。
Parent ✓
 ├─ Child ✓
 ├─ Child ✗
 ├─ Child ✗
 └─ Child ✗
這個情境用來觀察:
當真正發生變化的 Child 很少時,Update Cost 是否仍然會受到整棵 Component Tree 規模影響?
讓所有 Child 同時發生變化。
Parent ✓
 ├─ Child ✓
 ├─ Child ✓
 ├─ Child ✓
 └─ Child ✓
這是刻意建立的高負載情境,如果 500 個 Child 都需要更新,就可以觀察:
當大量 Component 確實需要工作時,Cost 會如何隨 Component 數量增加?
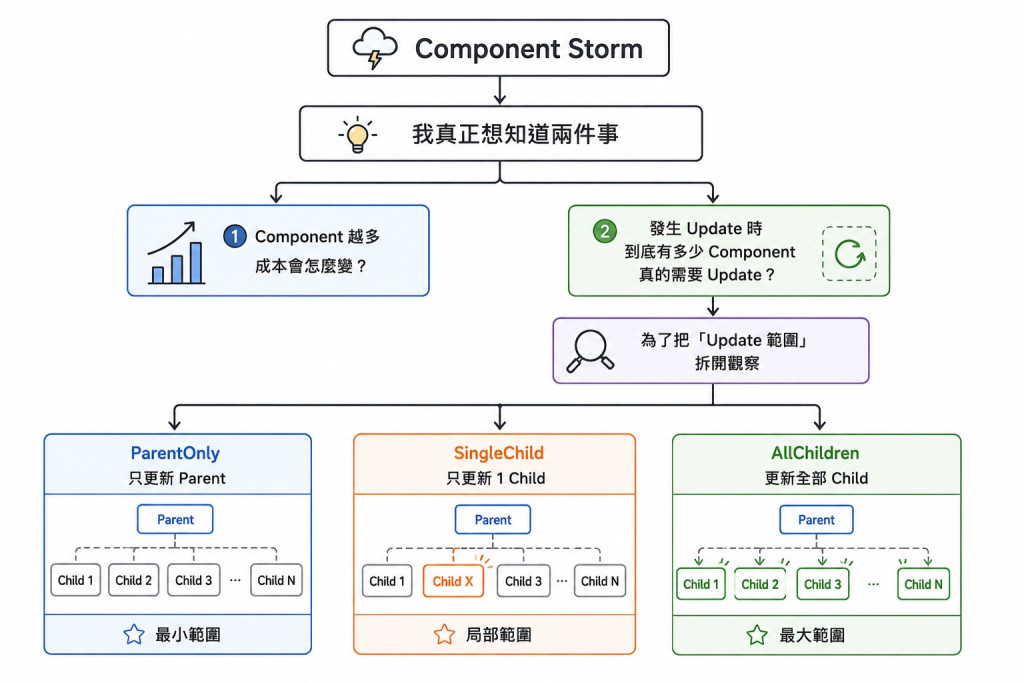
先固定 Component Count = 500 ,然後讓同一棵 Component Tree 分別執行:
ParentOnly
     ↓
SingleChild
     ↓
AllChildren
這樣就可以先回答一個比較單純的問題:
Component 數量相同時,只改變 Update Scope,成本會差多少?
三種 Scope 的 Median Average Update Duration:
| Update Scope | Update Duration | Updated Components | Child Render |
|---|---|---|---|
| ParentOnly | 8.770 ms | 0 | 0 |
| SingleChild | 9.000 ms | 1 | 100 |
| AllChildren | 187.405 ms | 500 | 50,000 |
這組數據有一個很明顯的分界:ParentOnly 的 Update Duration 與 SingleChild 幾乎接近,但到了 AllChildren 187.405 ms, 相較 ParentOnly 約為 21.4 倍,可由下圖 trend chart 更明顯看到差異。
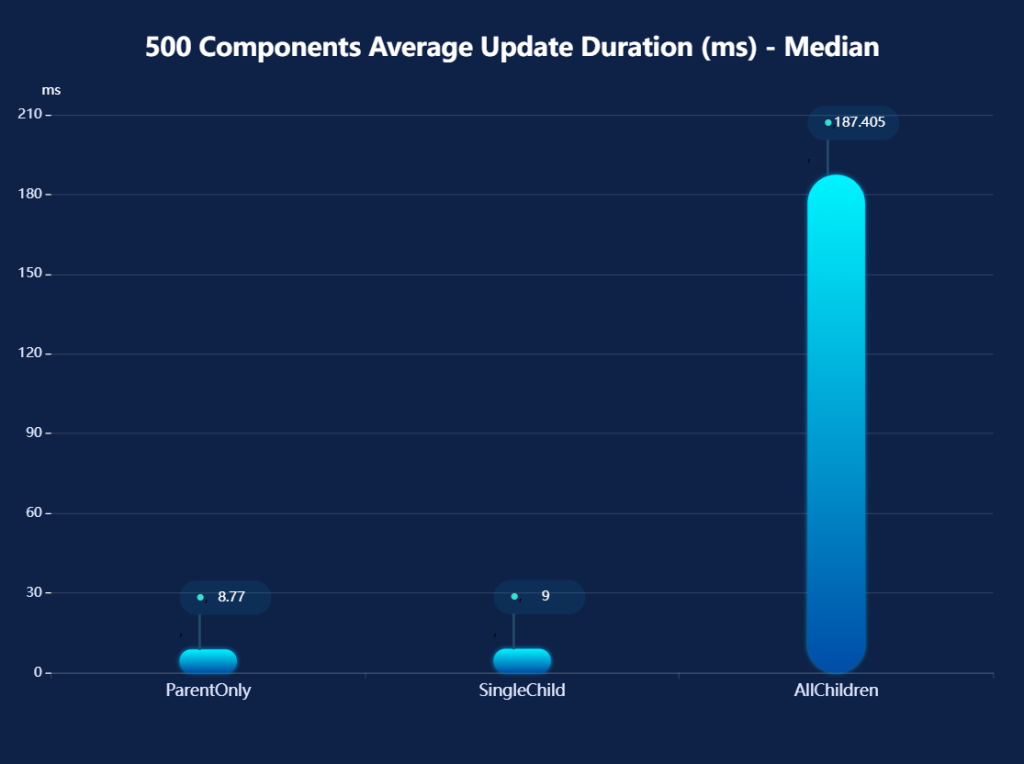
這代表在這個 Scenario 中,真正大量發生變化的 Component 數量,對 Update Cost 有非常明顯的影響。
但這還不能回答另一個問題:
如果真正更新的 Component 很少,單純把 Component Tree 做大,成本是不是仍然會增加?
所以接下來把 Component Count 拉開。
同一套 Scenario 繼續測不同 Components 數量,結果如下:
| Update Scope | 100 | 500 | 1000 |
|---|---|---|---|
| ParentOnly | 1.661 ms | 8.770 ms | 20.839 ms |
| SingleChild | 2.313 ms | 9.000 ms | 19.846 ms |
| AllChildren | 31.751 ms | 187.405 ms | 327.393 ms |
把數據畫成趨勢圖後,可以看到三條線都隨著 Component Count 增加而上升,但三種 Scope 的意義並不一樣。
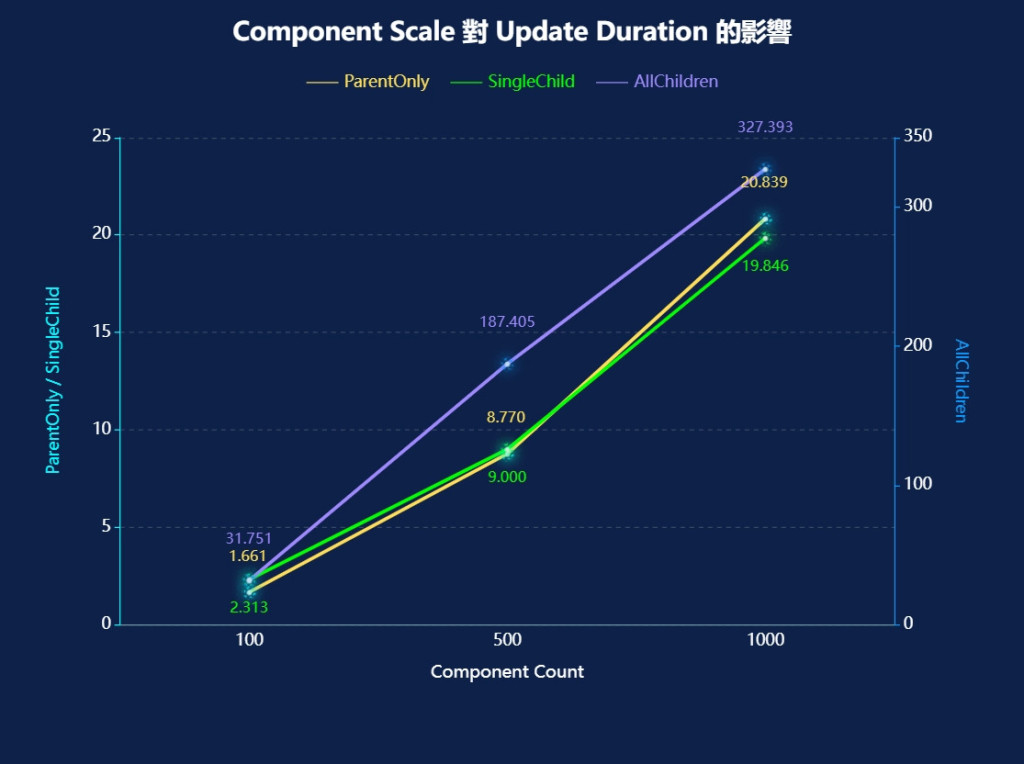
這兩種情境裡,真正被修改的 Child 數量始終非常少:
ParentOnly   → 0 Child
SingleChild  → 1 Child
但 Component Count 從 100 到 1,000,Update Duration 仍然持續增加。
ParentOnly
1.661 → 8.770 → 20.839 ms

SingleChild
2.313 → 9.000 → 19.846 ms
也就是說,在這個 Scenario 裡:
Update Cost 並不只取決於「有多少 Component 真的發生資料變化」,Component Tree 本身的規模也會影響成本。
AllChildren 的數據發現當 Component 數量增加,同時需要更新的 Child 也一起增加,成本因此進一步放大。
這讓目前的 Baseline 可以先整理成兩個層次:
Component Tree Scale
        │
        ▼
即使少量 Component 改變
也存在一定的 Update Cost
        │
        ▼
如果大量 Component 同時改變
        │
        ▼
Update Cost 進一步放大
因此,Component 數量 與 實際更新範圍 是兩個需要分開觀察的因素。
這也是 Component Storm Scenario 存在的原因:
不只測「有沒有變慢」,而是把 Component Scale 與 Update Scope 拆開,讓後續版本比較可以知道差異發生在哪裡。
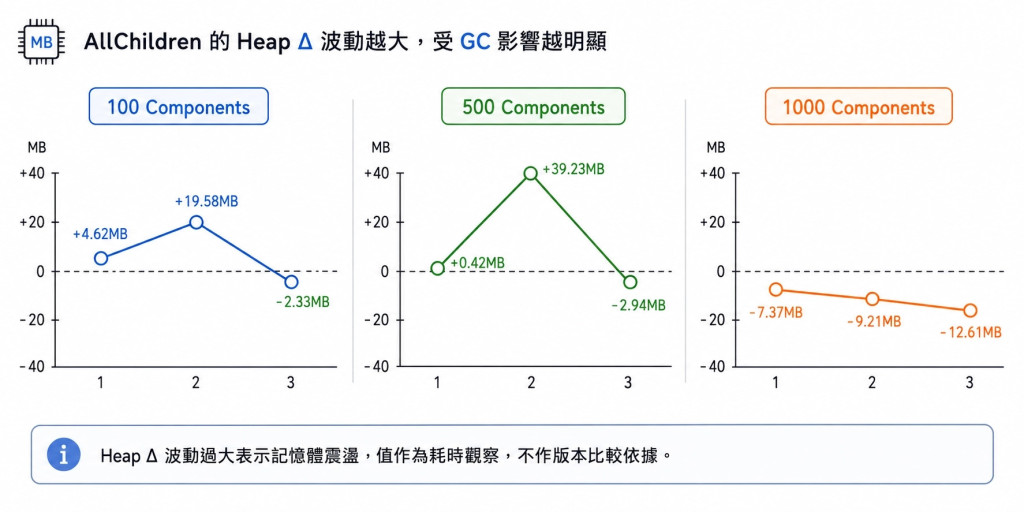
這次也有記錄 Memory,但它沒有被放進主要結論。
例如 500 Components、AllChildren 的三次 Heap Δ 就存在明顯波動;到了 1000 Components,甚至三次 AllChildren 的 Heap Δ 都出現負值,如下圖所示。
這並不能解讀成:
「更新 Component 之後,Memory 反而變少。」
更合理的解讀是:
在目前的測量環境中,V8 Garbage Collection 的時機足以干擾 Heap Δ 這個訊號。
因此這次 Memory 只作為輔助觀察,不拿它判斷 Vue 3.5 與 Vue 3.6 的 Runtime 差異,這也是 Baseline 實驗很重要的一部分:
不是每一個測出來的數字,都值得拿來下結論。
到這裡,Vue 3.5.40 的 Component Storm Baseline 已經建立完成,目前可以確認的是:
Component Count ↑
        ↓
Update Duration ↑

而當 Update Scope 擴大:

ParentOnly
     ↓
SingleChild
     ↓
AllChildren
     ↓
Cost 明顯放大
明天只改成 Vue 3.6.0-rc.2 再跑一次今天的所有流程後,再比較:
真正要確認的是:
Vue 3.6 的改善,來自「需要工作的 Component 變少」,還是「每個 Component 的 Update Unit Cost 變低」?


 iThome鐵人賽
 看影片追技術