
Composable Chaos Baseline:Depth 變深之後,Cost 到底增加在哪裡?
昨天完成 composable-chaos Scenario,今天固定使用 Vue 3.5.40 建立 Baseline,實驗只改變 State Flow 的 Depth:
Depth 1
State → Computed → UI

Depth 5
State → Computed → Computed → ... → UI

...

Depth 20
State → Computed → Computed → ... → Computed → UI
Component、Watch、Render、Benchmark parameters 都維持相同,主要確認 State Flow 變深之後,增加的工作發生在哪一層?
先看 Scenario instrumentation:
| Depth | 1 | 5 | 10 | 20 |
|---|---|---|---|---|
| Average Update Duration (ms) | 0.469 | 0.730 | 0.696 | 1.012 |
| Computed Execute Count | 0 | 404 | 909 | 1919 |
| Watch | 100 | 100 | 100 | 100 |
| WatchEffect | 101 | 101 | 101 | 101 |
| Render | 201 | 201 | 201 | 201 |
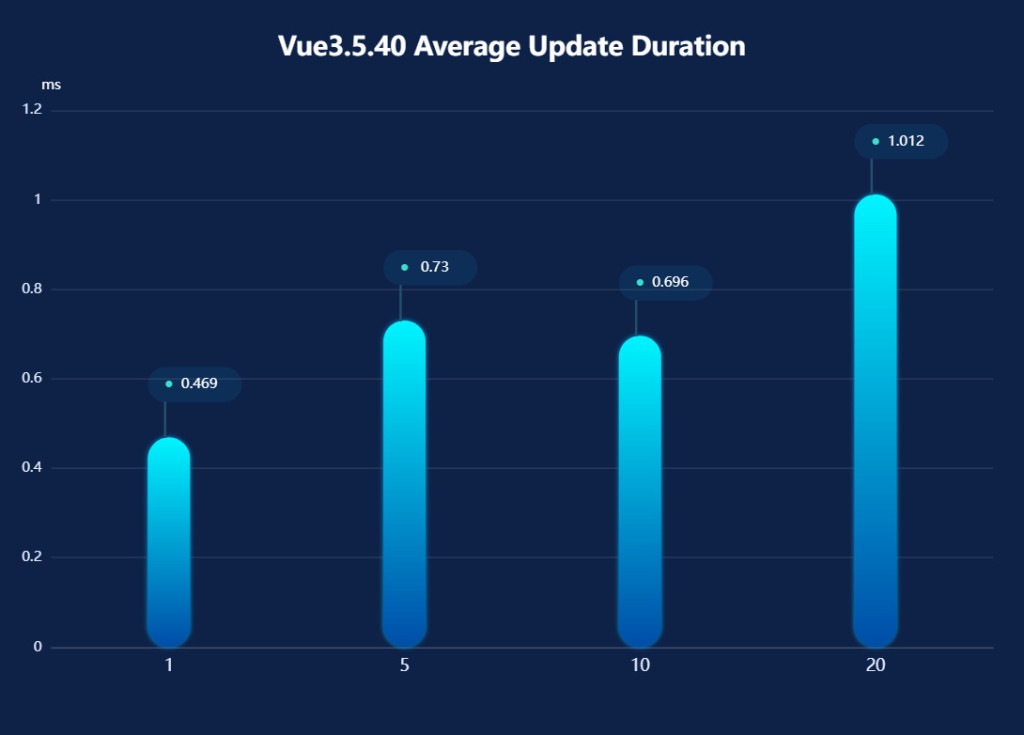
如果只看 performance.now(),確實 Depth 越深越慢,但這組資料不能支持這個結論,因為Depth 1 → 5、5 → 10 的 measurement range 有重疊,目前只能視為 No Meaningful Difference。
比較明確的差異出現在 Depth 10 → 20,以及 Depth 1 → 20,這也是 Baseline 很重要的一點:Timing 有波動時,先不要替它解讀成趨勢。
那麼,Depth 增加後真正穩定增加的是什麼?
同一份資料再看 Computed Execute Count,結果完全不同。
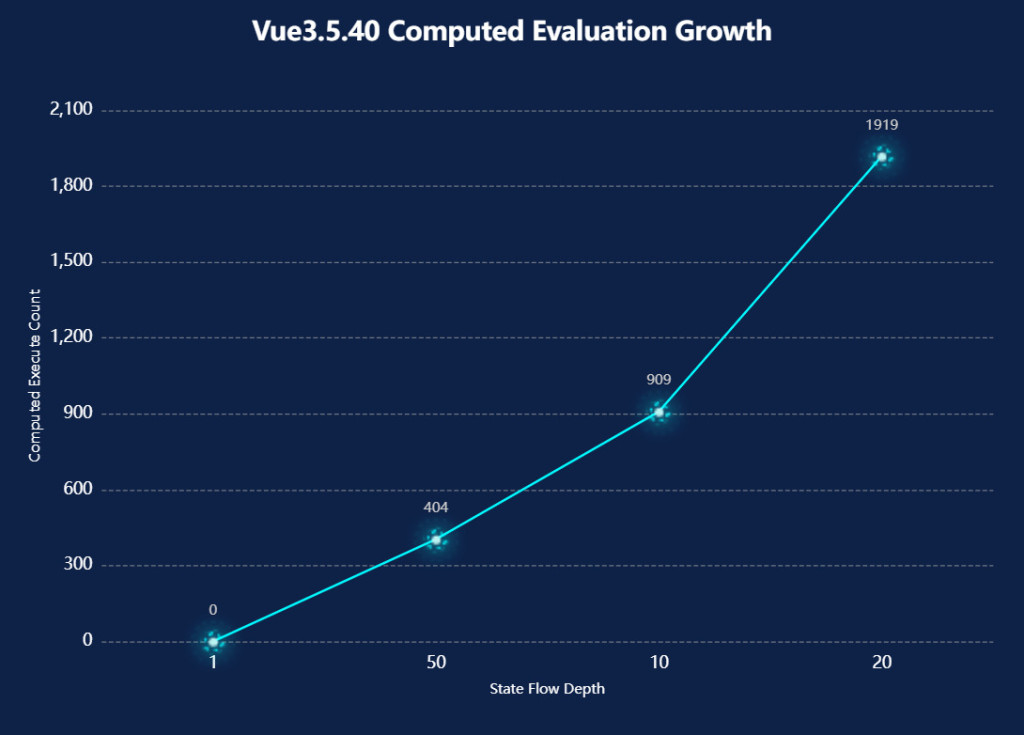
而且每個 Depth 都符合:
(Depth - 1) × 101
例如:
Depth 5  → (5 - 1) × 101 = 404
Depth 10 → (10 - 1) × 101 = 909
Depth 20 → (20 - 1) × 101 = 1919
這不是 timing noise,而是 Scenario 結構直接產生的計數結果,因此目前可以確認:
State Flow Depth ↑
        │
        ▼
Computed Evaluation ↑
接著要確認這些額外的 Computed Work,有沒有讓 Watch 和 Render 一起增加。
從數據看答案很清楚:
Watch       = 100
WatchEffect = 101
Render      = 201
Depth 1、5、10、20 都維持相同,因此目前觀察到的 State Flow scaling 集中在中間的 Reactive / Computed Flow:
State Mutation
      │
      ▼
Computed Flow
      │
      ├── Watch       → 不變
      └── Render      → 不變
這也讓我們可以把兩種成本拆開看:
但 Scenario instrumentation 還不足以回答 Browser 實際執行了多少 JavaScript。
因此第二輪使用前面建立的 CDP infrastructure:
composable-chaos
       │
       ├── cost-trace
       └── runtime-attribution-trace
                 │
                 ▼
          Chrome trace evidence
每個 Depth 使用 3 次 warm-up + 5 次 measurement trials,CDP 的 Scripting (update):
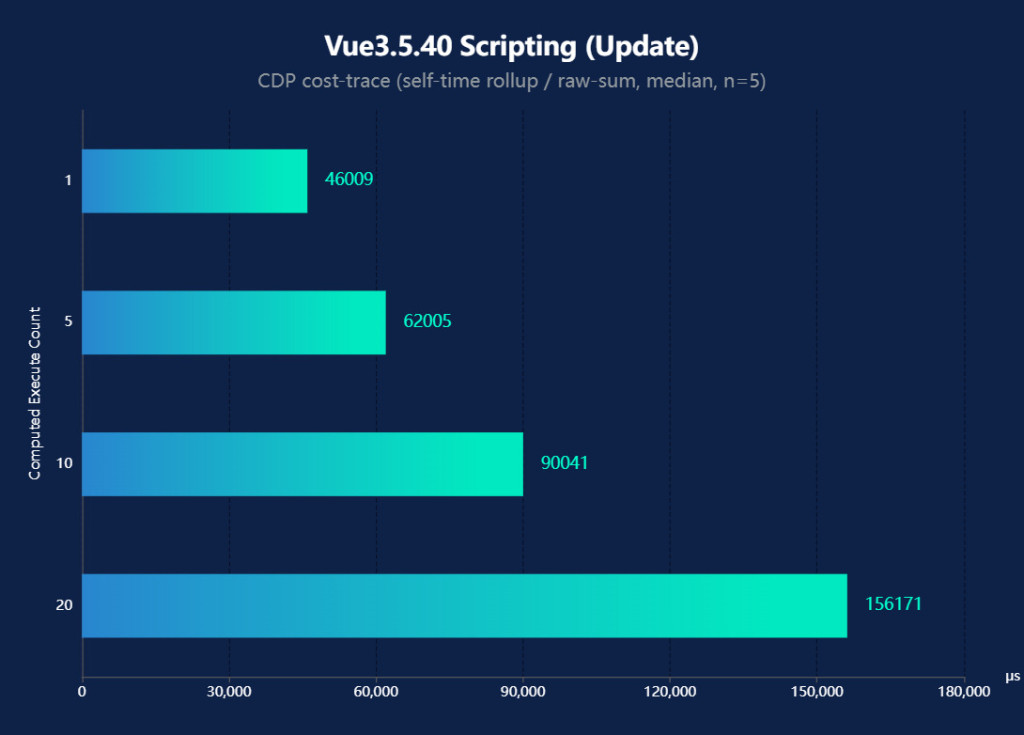
這裡的訊號比前面的 sub-ms performance.now() 更清楚,Scripting cost 隨 State Flow Depth 增加而持續上升,從Depth 1的 46,009 µs 上升到 Depth 20的 156,171 µs,總體增加約3.39倍 (+239.4%)。
也就是說,Depth 增加後,Browser 觀察到的 JavaScript execution cost 確實增加。
再把 CDP Cost 分層:
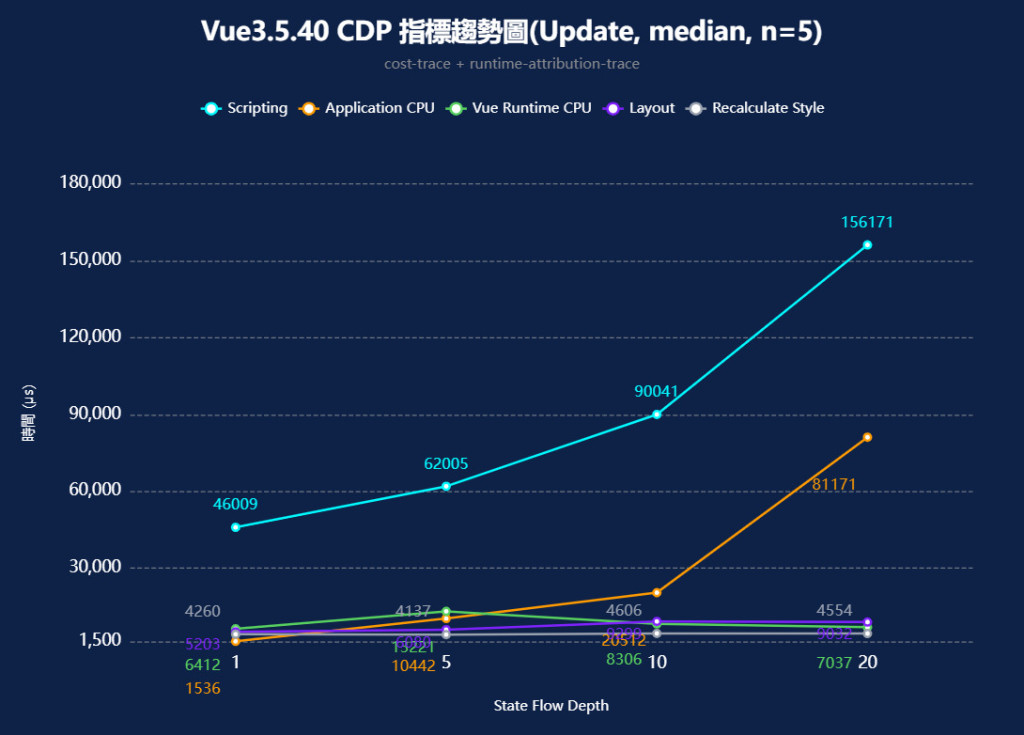
其中 Scripting 和 Browser Layout 這兩個訊號顯示:目前看不到 Browser Layout 隨 State Flow Depth 持續 scaling 的證據。
Scripting 隨 Depth 增加
這和前面的 Computed Execute Count 趨勢一致。
Browser Layout 沒有持續增加
Depth 10 → 20:
Scripting : 90.0 → 156.2 ms
Layout    :  9.3 →   9.03 ms
另一方面,Vue Runtime CPU:
6.41 → 13.22 → 8.31 → 7.04 ms
也沒有呈現一致的成長曲線,所以目前不能把全部增加的 JavaScript execution cost 直接歸因於 Vue Runtime。
今天得到的結果可以整理成一條 Cost Chain:
State Flow Depth ↑
        │
        ▼
Computed Execute Count ↑
        │
        ▼
Scripting Cost ↑
        │
        ├── Watch       → 不變
        ├── Render      → 不變
        ├── Layout      → 沒有持續增加
        └── Vue Runtime → 尚無一致 scaling signal
目前可以確認 State Flow 越深,Computed Evaluation 與 JavaScript execution work 越多。
但是目前還無法回答這些增加的成本,有多少來自 Reactive / Computed Chain?又有多少來自 Composable layer 本身?
因為目前兩者同時隨 Depth 增加:
Depth ↑
 ├── Composable Layer ↑
 └── Computed Chain   ↑
所以 Baseline 先把 Cost Structure 固定下來,Day 25:維持完全相同的 Scenario,換成 Vue 3.6.0-rc.2,確認這條 Cost Chain 哪一段真的發生變化。



 iThome鐵人賽
 看影片追技術