
內建的 Dashboard 很完整,但欄位太多,要的東西散在好幾張圖裡。今天來試著自己做一張
回到 Grafana,左邊選單 Dashboards → 右上角 New → 選 New dashboard → 然後 Add panel → configure visualization → 資料來源選 Prometheus
第一個 Panel 是 Pod 目前的狀態
kube_pod_status_phase{namespace="ithome-lab"} > 0
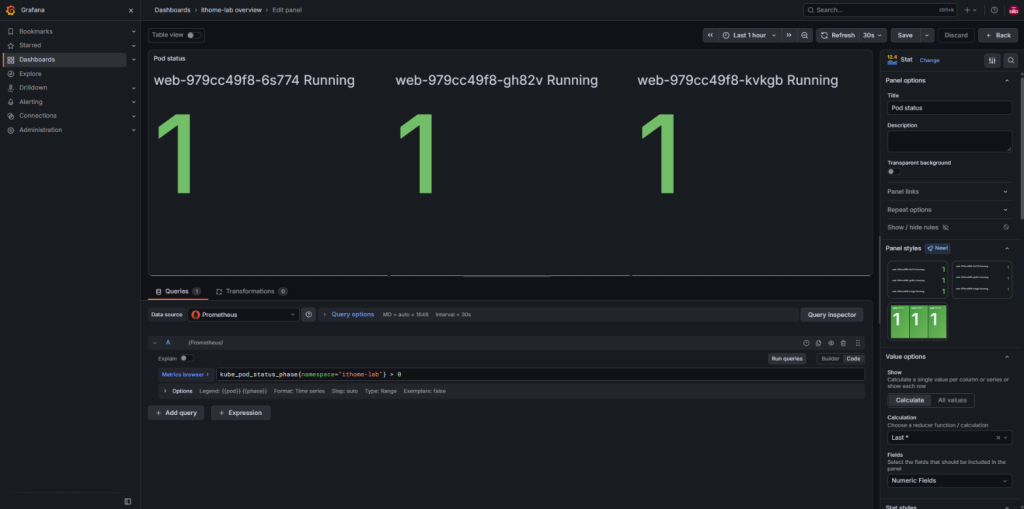
後面加 > 0 是因為 Day 26 說過這個指標把每種 phase 都列出來,不是的給 0。加了條件之後只會留下真正的那個狀態,畫面乾淨很多
視覺化類型選 Stat,因為我要的是現在幾個、什麼狀態,不是歷史曲線。右邊的 Legend 欄位填這個
{{pod}} {{phase}}
雙大括號是取標籤的值,不填的話圖例會是一整串完整的標籤
第二個 Panel 是重啟次數
increase(kube_pod_container_status_restarts_total{namespace="ithome-lab"}[10m])
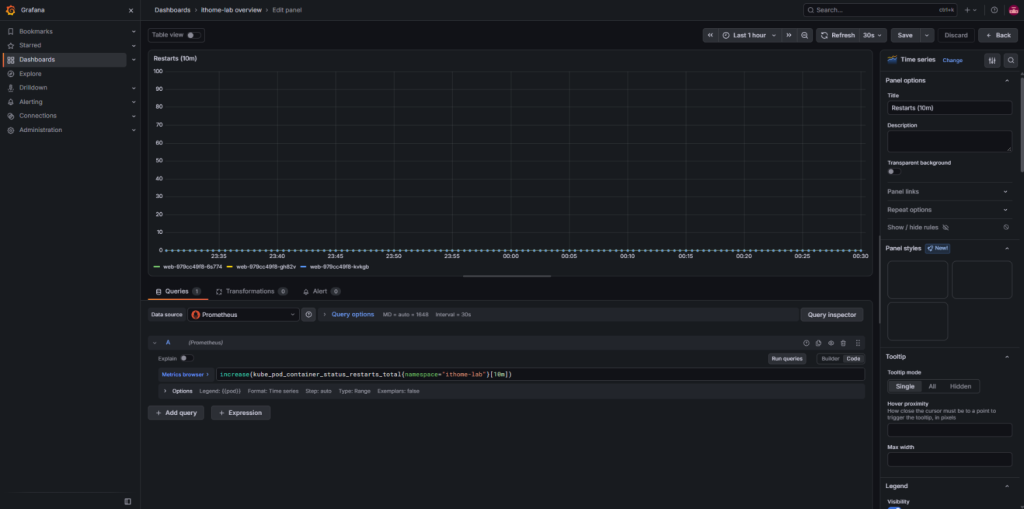
這個要選 Time series 不要 Stat,因為重點是有沒有在變。一個當下的數字看不出趨勢,而重啟這種事就是要看趨勢
第三個 Panel 是記憶體用量
container_memory_working_set_bytes{namespace="ithome-lab", container="nginx"}
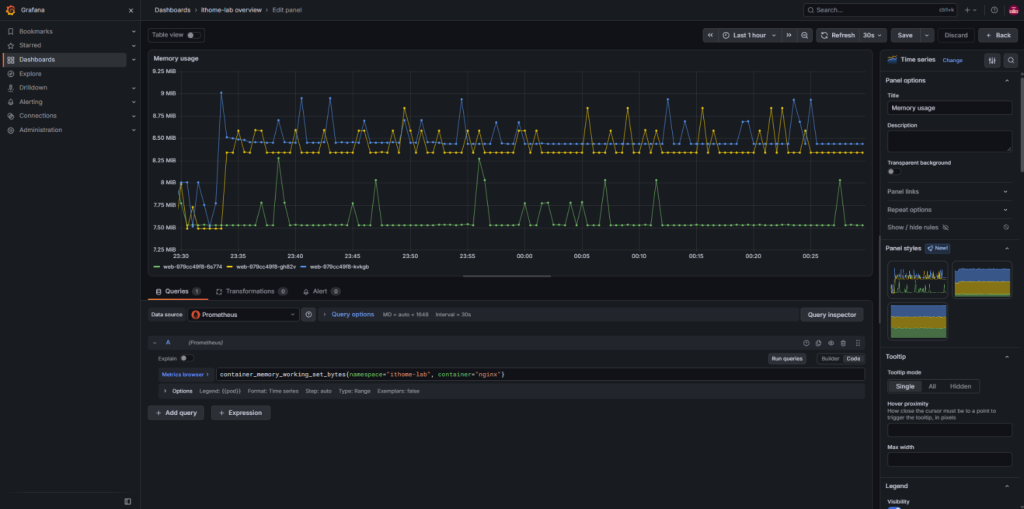
指標選 container_ 開頭的,後面加 container="nginx" ,因為每個 Pod 除了自己的容器還有一些系統層級的東西,不篩會多出一堆看不懂的線
單位要記得設。右邊面板找 Standard options 裡的 Unit,選 bytes
三個都做完之後右上角存檔,取個名字例如 ithome-lab overview
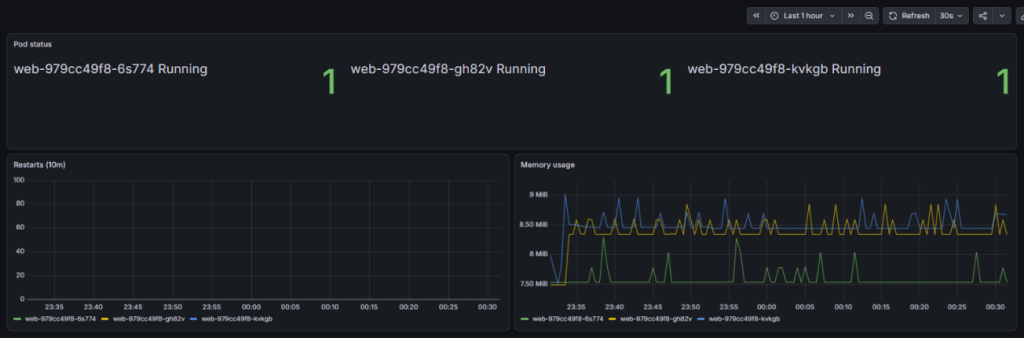
Dashboard 可以匯出成 JSON。右上角分享或設定裡面找 JSON Model,複製下來存成檔案
manifests/grafana/ithome-lab-overview.json
Day 24 裝的那包附帶一個叫 PrometheusRule 的自訂資源,可以用 YAML 定義告警規則
apiVersion: monitoring.coreos.com/v1
kind: PrometheusRule
metadata:
  name: ithome-lab-rules
  namespace: monitoring
  labels:
    release: monitoring
spec:
  groups:
    - name: ithome-lab
      rules:
        - alert: PodRestartingTooOften
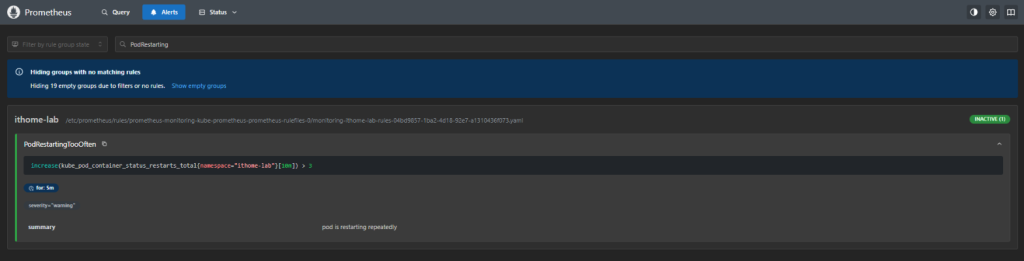
          expr: increase(kube_pod_container_status_restarts_total{namespace="ithome-lab"}[10m]) > 3
          for: 5m
          labels:
            severity: warning
          annotations:
            summary: "pod is restarting repeatedly"
expr 就是 Day 26 練的那種查詢,for 的意思是這個條件要持續成立五分鐘才真的發出告警,避免一閃而過的狀況一直吵人。labels 跟 annotations 的分工跟 Day 7 講的一樣,前者拿來篩選跟路由,後者放給人看的說明
kubectl apply -f manifests/monitoring/prometheusrule.yaml
明天見 :D




 iThome鐵人賽
 看影片追技術