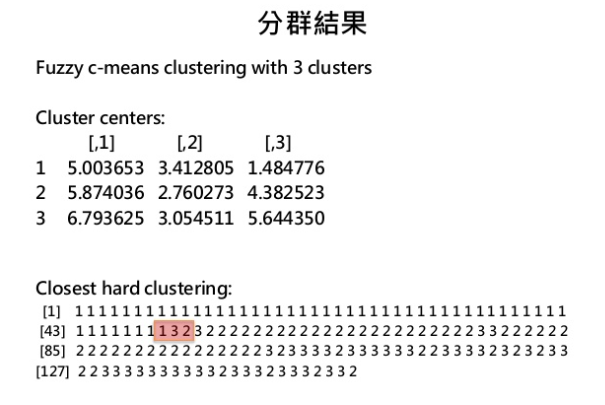
我想得到的是像這樣這樣從第一個分群的值 例如他這樣從第一個開始111122312... 但這是R 的C-means
python都是K-means 我有找到python的
https://pythonhosted.org/scikit-fuzzy/auto_examples/plot_cmeans.html
有比較簡單的範例教學可以懂嗎 我看得懂k-means但這的範例雖可執行但我卻看不太懂?
pip install -U scikit-fuzzy
import skfuzzy as fuzz
這個這樣做的作法跟c-means是一樣的嗎或者k-means也能做出這樣的效果?
還是各位有什麼建議可以跟我講一下嗎?
已邀請的邦友 {{ invite_list.length }}/5
from __future__ import division, print_function
import numpy as np
import matplotlib.pyplot as plt
import skfuzzy as fuzz

colors = ['b', 'orange', 'g', 'r', 'c', 'm', 'y', 'k', 'Brown', 'ForestGreen']

# Define three cluster centers
centers = [[4, 2],
           [1, 7],
           [5, 6]]

# Define three cluster sigmas in x and y, respectively
sigmas = [[0.8, 0.3],
          [0.3, 0.5],
          [1.1, 0.7]]
你是說這邊嗎?這邊只是測試資料集,先設定中心點(centers)和離散程度(sigmas),利用random,產生200個點。
做研究要學著看英文,人家註釋寫得很清楚。
我成功執行了 感謝
//k-means
kmeans_fit = cluster.KMeans(n_clusters = 6).fit(newData)
cluster_labels = kmeans_fit.labels_
ppt=kmeans_fit.labels_
//印出績效
silhouette_avg = metrics.silhouette_score(newData, cluster_labels)
print(silhouette_avg)
print(ppt[:120])
0.4639289840822076
[2 2 2 2 2 2 2 2 2 2 2 2 2 2 2 0 0 0 1 4 4 4 2 0 0 2 2 0 0 2 2 1 1 1 2 2 0 0 0 0 5 1 1 1 1 1 1 1 1 1 1 1 5 5 5 5 5 5 5 5 5 5 5 1 1 1 1 5 5 5 5 5 5 5 5 5 5 5 5 5 5 5 5 5 5 3 3 3 3 3 3 3 3 3 3 3 3 3 3 3 3 3 3 3 3 3 3 3 3 3 3 3 3 3 3 3 3 3 3 3]
我想請問 我k-means可以印出每個值得群是多少
我執行雖然成功 但我常是要讓他印出每個值得群是多少 該怎麼下手呢?

 iThome鐵人賽