你可以在 tooltip 內加入 formatter 這個參數,傳遞過來的 params 參數為對應的資料,可以自行 console.log 來看有哪些資料
可以參考官網的 option.tooltip.formatter 文檔
option = {
tooltip: {
trigger: 'item',
formatter(params) {
console.log(params) // 這為對應的資料返回,可以從中取你想要的資料掛在 return 中
// 返回 html string
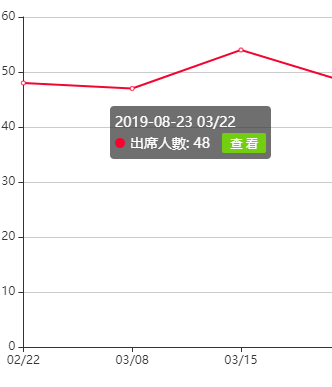
return `
<div>2019-08-23 03/22</div>
<div>
<i style="display:inline-block;border-radius:50%;background-color:red;width:10px;height:10px;margin-right:4px;"></i>
出席人數: 48
<button>查看</button>
</div>
`
}
},
// ...
}
看起來可行 @@
但是這樣可以在button 上面綁點擊事件嗎 0.0 ?
謝謝大神的解答!他是可以跑出我想要的效果的,不過我想請問,我想要在裡面加入我抓資料庫的值,我想請問我該怎麼做?麻煩大神了!
以下是我目前的程式碼:
var counts= [],warnings = [];


    function getusers() {
        $.ajax({
             type: "get",
             async: false,
             url: "warningdata.php",
             data: {},
             dataType: "json",

             success: function (result){
                if(result){
                    for(var i = 0 ; i < result.length; i++){
                        counts.push(result[i].count);
                        warnings.push(result[i].warning);
                    }
                }
            },

        });
    return counts,warnings;
    }


    getusers();

var myChart = echarts.init(document.getElementById('warning'));


var option = {
  tooltip: {
        trigger: 'item',
        alwaysShowContent:true,
        triggerOn: 'click',
        formatter(params) {
      console.log(params) // 這為對應的資料返回,可以從中取你想要的資料掛在 return 中
      // 返回 html string
      return `
        <div>counts</div>
        <div>
          <i style="display:inline-block;border-radius:50%;background-color:red;width:10px;height:10px;margin-right:4px;"></i>
          出席人數: 48
          <button>查看</button>
        </div>
      `
        }
    },
    legend: {
        top: '5%',
        left: 'center'
    },
    series: [
        {
            name: '預警',
            type: 'pie',
            radius: ['40%', '70%'],
            avoidLabelOverlap: false,
            itemStyle: {
                borderRadius: 10,
                borderColor: '#fff',
                borderWidth: 2
            },
            label: {
                show: false,
                position: 'center'
            },
            emphasis: {
                label: {
                    show: true,
                    fontSize: '20',
                    fontWeight: 'bold'
                }
            },

            data: [
                {value: counts[3], name:warnings[3]},
                {value: counts[2], name:warnings[2]},
                {value: counts[1], name:warnings[1]},
                {value: counts[0], name:warnings[0]},


            ]
        }
    ]
};
可以綁點擊事件呀,formatter 也是可以返回 htmlElement 的
你的資料是從 ajax 獲取的,這樣我會建議你把修改 chart init 移至 api callback 內,如下:
function init() {
    $.ajax({
        type: "get",
        async: false,
        url: "warningdata.php",
        data: {},
        dataType: "json",
        success: function(result) {
            var counts = [],
                warnings = [];
            if (result) {
                for (var i = 0; i < result.length; i++) {
                    counts.push(result[i].count);
                    warnings.push(result[i].warning);
                }
                // 等 api 資料返回時在初始化數據圖
                initChart({counts: counts, warnings: warnings})
            }
        },

    });
}

function initChart(data) {
  // 這裡將會是你的資料庫的資料,下方的 echart option 就可以調用到這些資料
  var counts = data.counts
  var warnings = data.counts

  var myChart = echarts.init(document.getElementById('warning'));
  var option = {
      tooltip: {
          trigger: 'item',
          alwaysShowContent: true,
          triggerOn: 'click',
          formatter(params) {
              console.log(params) // 這為對應的資料返回,可以從中取你想要的資料掛在 return 中
              // 返回 html string
              return `
          <div>counts</div>
          <div>
            <i style="display:inline-block;border-radius:50%;background-color:red;width:10px;height:10px;margin-right:4px;"></i>
            出席人數: 48
            <button>查看</button>
          </div>
        `
          }
      },
      legend: {
          top: '5%',
          left: 'center'
      },
      series: [{
          name: '預警',
          type: 'pie',
          radius: ['40%', '70%'],
          avoidLabelOverlap: false,
          itemStyle: {
              borderRadius: 10,
              borderColor: '#fff',
              borderWidth: 2
          },
          label: {
              show: false,
              position: 'center'
          },
          emphasis: {
              label: {
                  show: true,
                  fontSize: '20',
                  fontWeight: 'bold'
              }
          },

          data: [{
                  value: counts[3],
                  name: warnings[3]
              },
              {
                  value: counts[2],
                  name: warnings[2]
              },
              {
                  value: counts[1],
                  name: warnings[1]
              },
              {
                  value: counts[0],
                  name: warnings[0]
              },
          ]
      }]
  };
}
我不知道你會不會有動態篩選資料,所以就當作你只會取一次資料並渲染來寫
Mizok
你可以給 tooltip enterable: true 的參數,表示滑鼠可以移至 tooltip 中
如果你覺得 tooltip 會跟隨滑鼠不好移入,可以使用 position 參數來將 tooltip 定在中間或你想要之位置
接著 formatter 使用 HTMLElement 返回即可,
如果你是 vue 可以 mount 一個 vue 實例再返回出去
或者是 react 的話可以使用 React createElement 返回 react component
再者是原生的話就是基本的 createElement / append 處理即可
至於其他也就都是差不多的操作
如下代碼(原生):
{
    // 僅展示 formatter 代碼片段,以下代碼等同於以上字串返回的呈現結果
    formatter(params) {
      const wrap = document.createElement('div');
      const date = document.createElement('div');
      const contentWrap = document.createElement('div');
      const dot = document.createElement('i');
      const mans = document.createElement('span');
      const button = document.createElement('button');

      date.innerText = '2019-08-23 03/22';
      wrap.append(date);

      dot.style.display = 'inline-block';
      dot.style.borderRadius = '50%';
      dot.style.backgroundColor = 'red';
      dot.style.width = '10px';
      dot.style.height = '10px';
      dot.style.marginRight = '4px';
      contentWrap.append(dot);

      mans.innerText = '出席人數: 48 ';
      contentWrap.append(mans);

      button.innerText = '查看';
      contentWrap.append(button);

      wrap.append(contentWrap);

      // 綁定查看按鈕的點擊事件
      button.onclick = function () {
        console.log('hello world');
      };

      return wrap;
    }
}
了解!
解釋得很詳細

 iThome鐵人賽