今天將探討系統溫度的監測.
系統溫度在Linux 常用lm-sensor 與 hddtemp 來獲得相關資訊.
以下是某機器上的回報結果:
$ sensors
coretemp-isa-0000
Adapter: ISA adapter
Core 0:      +41.0°C  (high = +78.0°C, crit = +100.0°C)

coretemp-isa-0001
Adapter: ISA adapter
Core 1:      +30.0°C  (high = +78.0°C, crit = +100.0°C)

atk0110-acpi-0
Adapter: ACPI interface
Vcore Voltage:     +1.06 V  (min =  +0.85 V, max =  +1.60 V)
 +3.3 Voltage:     +3.34 V  (min =  +2.97 V, max =  +3.63 V)
 +5 Voltage:       +4.96 V  (min =  +4.50 V, max =  +5.50 V)
 +12 Voltage:     +12.14 V  (min = +10.20 V, max = +13.80 V)
CPU FAN Speed:     838 RPM  (min =  600 RPM)
CHASSIS FAN Speed:1360 RPM  (min =  200 RPM)
CPU Temperature:   +33.0°C  (high = +60.0°C, crit = +95.0°C)
MB Temperature:    +30.0°C  (high = +45.0°C, crit = +95.0°C)
hddtemp 已經設定為 Daemon Mode,會使用 7634 Port,用NetCat 測試反應
$ nc localhost 7634
|/dev/sda|ST3500413AS|34|C|
這樣子我們就可以很輕易的來長期觀察系統溫度.
以下將以 CPU Temperature, MB Temperature, CPU FAN Speed, CHASSIS FAN Speed,HD Temperature 幾項來蒐集資料.
首先是建立rrd file.
#!/usr/bin/env python
# ------------------------
# Python RRDTool MySQL
# System temperature
# create rrd file
# -----------------------

import rrdtool

rrdtool.create(
    'systemp.rrd', '--step', '60',
    'DS:cputemp:GAUGE:120:0:U',
    'DS:mbtemp:GAUGE:120:0:U',
    'DS:hdtemp:GAUGE:120:0:U',
    'DS:cpufan:GAUGE:120:0:U',
    'DS:chassisfan:GAUGE:120:0:U',
    'RRA:AVERAGE:0.5:1:2880',
    'RRA:AVERAGE:0.5:30:672',
    'RRA:AVERAGE:0.5:60:744',
    'RRA:AVERAGE:0.5:720:732',
    'RRA:MAX:0.5:1:2880',
    'RRA:MAX:0.5:30:672',
    'RRA:MAX:0.5:60:744',
    'RRA:MAX:0.5:720:732',
    'RRA:MIN:0.5:1:2880',
    'RRA:MIN:0.5:30:672',
    'RRA:MIN:0.5:60:744',
    'RRA:MIN:0.5:720:732',
    'RRA:LAST:0.5:1:2880',
    'RRA:LAST:0.5:30:672',
    'RRA:LAST:0.5:60:744',
    'RRA:LAST:0.5:720:732')
接著蒐集系統溫度的函式.
#!/usr/bin/env python
# ---------------------------
# Linux Temperature Utility
# with lm_sensors
# and HDDTemp
# ---------------------------

from subprocess import Popen, PIPE, STDOUT
import socket

HOST = 'localhost'
PORT = 7634

def get_sensors():
    """Get Core Temperature, FAN Speed and MB Temperature"""
    result_sensor = Popen("sensors", stdout=PIPE, stderr=STDOUT).communicate()[0]
    results = result_sensor.split('\n')
    cores = {}
    fans = {}
    boards = {}
    for line in results:
        data = line.split()
        if len(data) > 0:
            # Core Temp
            if data[0].startswith('Core'):
                corevar = data[0] + data[1][:-1]
                coretemp = data[2][:-3]
                coretemp = coretemp[1:]
                cores[corevar] = coretemp
            # -----------------
            if data[0].startswith('CPU'):
                if data[1] == 'FAN':
                    # CPU FAN Speed
                    fans[data[0]] = data[3]
                if data[1] == 'Temperature:':
                    # CPU Temperature
                    ctemp = data[2][:-3]
                    ctemp = ctemp[1:]
                    boards[data[0]] = ctemp
            # ----------------
            if data[0].startswith('CHASSIS'):
                # CHASSIS FAN Speed
                speed = data[2][6:]
                fans[data[0]] = speed
            #
            if data[0].startswith('MB'):
                # MB Temperature
                mtemp = data[2][:-3]
                mtemp = mtemp[1:]
                boards[data[0]] = mtemp
            #
    # -------------------------
    return cores, boards, fans
# ------------------------------------------

def get_hdd_temp():
    """For One HD"""
    s = socket.socket(socket.AF_INET, socket.SOCK_STREAM)
    s.connect((HOST, PORT))
    tempdata = s.makefile().read()
    s.close()
    tempdata = tempdata.split('|')
    hd_columns = ['hd_path', 'hd_type', 'hd_temp', 'hd_temp_unit_type']
    hd_values = tempdata[1:5]
    hddict  = dict(zip(hd_columns, hd_values))

    return hddict
# ----------------------------
if __name__ == '__main__':
    cores,boards,fans = get_sensors()
    print 'Cores:', cores
    print 'Boards:', boards
    print 'FAN Speeds:', fans
    print 'HD Temp:', get_hdd_temp()
然後是使用上述溫度函式,將資料存放到 rrd file的程式.
#!/usr/bin/env python
# ------------------------------
# Python RRDTool MySQL
# System temperature
# store data into rrd file
# -----------------------------

import rrdtool
import time
import temp_util

def update_systemp_rrd(rrdfile):
    coredict, mbdict, fandict = temp_util.get_sensors()
    # MB and CPU Temp
    mbtemp = float(mbdict['MB'])
    cputemp = float(mbdict['CPU'])
    # FAN Speed
    chassis_fan = int(fandict['CHASSIS'])
    cpu_fan = int(fandict['CPU'])
    # HD Temp
    hddict = temp_util.get_hdd_temp()
    hd1_temp = int(round(float(hddict['hd_temp'])))
    # Update RRD
    rrdtool.update(rrdfile, 'N:' + `cputemp` + ':' + `mbtemp` + ':' + \
        `hd1_temp` + ':' + `cpu_fan` + ':' + `chassis_fan`)
#
if __name__ == '__main__':
    while 1:
        update_systemp_rrd('systemp.rrd')
        time.sleep(60)
放到背景執行,會每分鐘更新rrd.
讓程式蒐集一陣子後,就可以繪圖了.
#!/usr/bin/env python
# ---------------------------
# Python RRDTool
# Memory Data
# Create Image from rrd file
# ---------------------------
import rrdtool
import datetime
def cpu_temp_graph(rrdfile, period):
timenow = datetime.datetime.now()
disptime = datetime.datetime.strftime(timenow, '%Y-%m-%d %H-%M-%S')
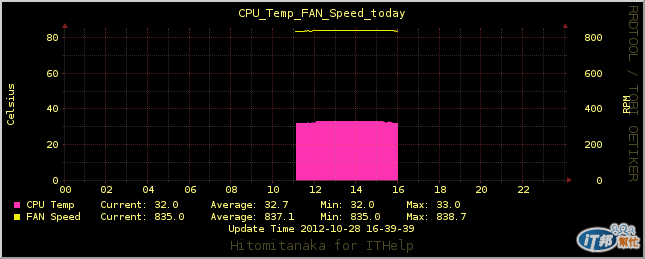
title = 'CPU_Temp_FAN_Speed_%s' % period
filename = title + '.png'
# -------------------
cputemp = 'DEF:cputemp=%s:cputemp:AVERAGE' % rrdfile
cpufan = 'DEF:cpufan=%s:cpufan:AVERAGE' % rrdfile
sfan = 'CDEF:sfan=cpufan,10,/'
# -------------------
if period == 'yesterday':
start = 'end-1d'
end = '00:00'
if period == 'today':
start = '00:00'
end = '23:59'
if period == '2h':
start = '-2h'
end = 'now'
rrdtool.graph(
filename,
'--start', start,
'--end', end,
'--title', title,
'-a', 'PNG',
'-W', 'Hitomitanaka for ITHelp',
'--slope-mode',
'--vertical-label=Celsius',
'--rigid',
'--lower-limit', '0',
'--width', '500',
'--height', '150',
'--right-axis', '10:0',
'--right-axis-label=RPM',
'--x-grid', 'HOUR:1:HOUR:2:HOUR:2:0:%H',
'--alt-y-grid',
'--color', 'BACK#000000',
'--color', 'CANVAS#000000',
'--color', 'FONT#FFF978',
'--font=LEGEND:7',
'--font', 'TITLE:8:',
'--font', 'UNIT:7:',
'--font', 'WATERMARK:9',
# ---------------------------------
cputemp,
cpufan,
sfan,
#----------------------------------
'AREA:cputemp#FF32B1:CPU Temp',
'GPRINT:cputemp:LAST: Current\\: %.01lf',
'GPRINT:cputemp:AVERAGE: Average\\: %.01lf',
'GPRINT:cputemp:MIN: Min\\: %.01lf',
'GPRINT:cputemp:MAX: Max\\: %.01lf\\n',
'LINE:sfan#EEEE00:FAN Speed',
'GPRINT:cpufan:LAST: Current\\: %.01lf',
'GPRINT:cpufan:AVERAGE: Average\\: %.01lf',
'GPRINT:cpufan:MIN: Min\\: %.01lf',
'GPRINT:cpufan:MAX: Max\\: %.01lf\\n',
'COMMENT:\t\t\t\t\tUpdate Time %s' % disptime)
#
def mb_temp_graph(rrdfile, period):
timenow = datetime.datetime.now()
disptime = datetime.datetime.strftime(timenow, '%Y-%m-%d %H-%M-%S')
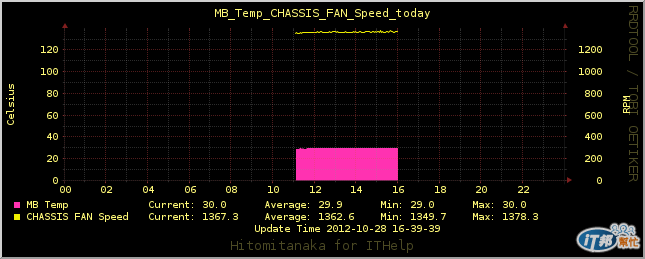
title = 'MB_Temp_CHASSIS_FAN_Speed_%s' % period
filename = title + '.png'
# -------------------
mbtemp = 'DEF:mbtemp=%s:mbtemp:AVERAGE' % rrdfile
chassisfan = 'DEF:chassisfan=%s:chassisfan:AVERAGE' % rrdfile
sfan = 'CDEF:sfan=chassisfan,10,/'
# -------------------
if period == 'yesterday':
start = 'end-1d'
end = '00:00'
if period == 'today':
start = '00:00'
end = '23:59'
if period == '2h':
start = '-2h'
end = 'now'
rrdtool.graph(
filename,
'--start', start,
'--end', end,
'--title', title,
'-a', 'PNG',
'-W', 'Hitomitanaka for ITHelp',
'--slope-mode',
'--vertical-label=Celsius',
'--rigid',
'--lower-limit', '0',
'--width', '500',
'--height', '150',
'--right-axis', '10:0',
'--right-axis-label=RPM',
'--x-grid', 'HOUR:1:HOUR:2:HOUR:2:0:%H',
'--alt-y-grid',
'--color', 'BACK#000000',
'--color', 'CANVAS#000000',
'--color', 'FONT#FFF978',
'--font=LEGEND:7',
'--font', 'TITLE:8:',
'--font', 'UNIT:7:',
'--font', 'WATERMARK:9',
# ---------------------------------
mbtemp,
chassisfan,
sfan,
#----------------------------------
'AREA:mbtemp#FF32B1:MB Temp',
'GPRINT:mbtemp:LAST: Current\\: %.01lf',
'GPRINT:mbtemp:AVERAGE: Average\\: %.01lf',
'GPRINT:mbtemp:MIN: Min\\: %.01lf',
'GPRINT:mbtemp:MAX: Max\\: %.01lf\\n',
'LINE:sfan#EEEE00:CHASSIS FAN Speed',
'GPRINT:chassisfan:LAST: Current\\: %.01lf',
'GPRINT:chassisfan:AVERAGE: Average\\: %.01lf',
'GPRINT:chassisfan:MIN: Min\\: %.01lf',
'GPRINT:chassisfan:MAX: Max\\: %.01lf\\n',
'COMMENT:\t\t\t\t\tUpdate Time %s' % disptime)
#
def hd_temp_graph(rrdfile, period):
timenow = datetime.datetime.now()
disptime = datetime.datetime.strftime(timenow, '%Y-%m-%d %H-%M-%S')
title = 'HD_Temp_%s' % period
filename = title + '.png'
# -------------------
hdtemp = 'DEF:hdtemp=%s:hdtemp:AVERAGE' % rrdfile
# -------------------
if period == 'yesterday':
start = 'end-1d'
end = '00:00'
if period == 'today':
start = '00:00'
end = '23:59'
if period == '2h':
start = '-2h'
end = 'now'
rrdtool.graph(
filename,
'--start', start,
'--end', end,
'--title', title,
'-a', 'PNG',
'-W', 'Hitomitanaka for ITHelp',
'--slope-mode',
'--vertical-label=Celsius',
'--rigid',
'--lower-limit', '0',
'--width', '500',
'--height', '150',
'--x-grid', 'HOUR:1:HOUR:2:HOUR:2:0:%H',
'--alt-y-grid',
'--color', 'BACK#000000',
'--color', 'CANVAS#000000',
'--color', 'FONT#FFF978',
'--font=LEGEND:7',
'--font', 'TITLE:8:',
'--font', 'UNIT:7:',
'--font', 'WATERMARK:9',
# ---------------------------------
hdtemp,
#----------------------------------
'AREA:hdtemp#FF32B1:HD Temp',
'GPRINT:hdtemp:LAST: Current\\: %.01lf',
'GPRINT:hdtemp:AVERAGE: Average\\: %.01lf',
'GPRINT:hdtemp:MIN: Min\\: %.01lf',
'GPRINT:hdtemp:MAX: Max\\: %.01lf\\n',
'COMMENT:\t\t\t\tUpdate Time %s' % disptime)
#
if __name__ == '__main__':
cpu_temp_graph('systemp.rrd', 'today')
mb_temp_graph('systemp.rrd', 'today')
hd_temp_graph('systemp.rrd', 'today')
會分別繪製 CPU溫度與風扇轉速, MB溫度與機箱風扇轉速, HD溫度,其中
溫度與風扇轉速,分別使用各自的Y軸.以利將不同單位的兩種數據放在一起觀察.

溫度與風扇轉速的數據長期蒐集,對我們了解系統運作的情形,可以提供很好的幫助.
例如發覺風扇轉速突然變高,溫度變高,就需要檢查一下硬體.
當機房裡面的Server 都有長期間蒐集溫度數據,我們就可以根據不同機櫃裡的
Server溫度差距,來了解機房空調配置是否有需要改良的地方.
甚至適當的調高機房溫度,以達到節能減碳.
以上種種都需要長時期且普遍的蒐集數據,進而得到整體平均數值,有利於適當調節溫度.


 iThome鐵人賽