在 google sheets 元件的篇幅裡,看到了畫圖表的元件,然而 EZoApp 其實有提供獨立的圖表元件,只要你餵給圖表元件 json 的檔案,那麼就會根據你的 json 長出特定的圖表,很方便噢!
1. flot-pie

( 範例,點選 preview 預覽:http://jqmdesigner.appspot.com/designer.html#&ref=5722436678975488 )
和 google-sheets-chart-pie 的呈現方式一模一樣,差別只在於這個元件必須要我們自己手動放入 json 資料,也因此在拖拉元件進入設計畫面之後,於 JS code 會長出一段程式碼,只需要在這邊把值填入即可。

$(document).on("gkComponentsReady", function () {
  var data = [{
    label: 'Games',
    data: 43
  }, {
    label: 'Social Networking',
    data: 26
  }, {
    label: 'Entertainment',
    data: 10
  }, {
    label: 'Utilities',
    data: 10
  }, {
    label: 'News',
    data: 2
  }, {
    label: 'Other',
    data: 9
  }];

  $('#gk-109Y0VB').gk('render', data);
})
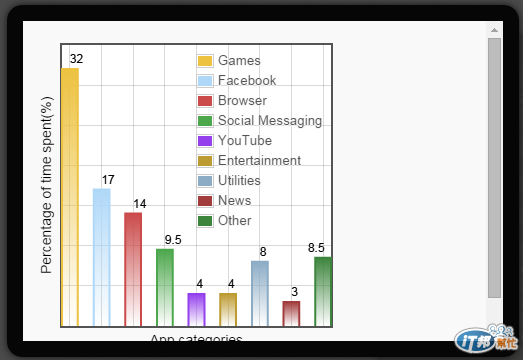
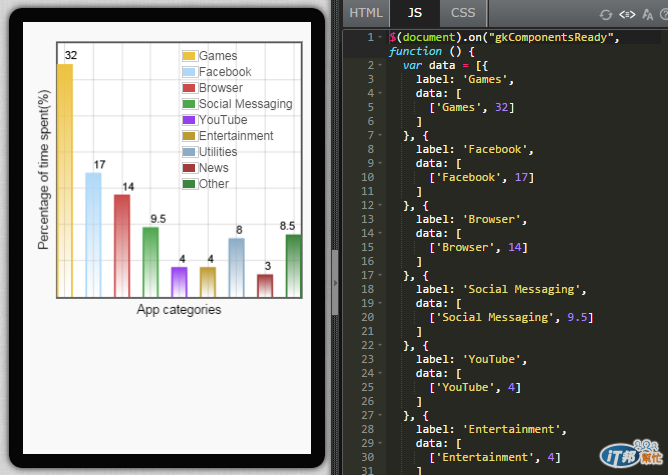
2. flot-bar

( 範例,點選 preview 預覽:http://jqmdesigner.appspot.com/designer.html#&ref=6212492447449088 )
與 google-sheets-chart-car 也是相同的呈現方式,並且又與 flot-pie 相同 ( 所以才都以 flot 作為開頭嗎? ) 拖拉進入設計畫面之後會有 JS code,可以自行添加 json 檔案就可以自動產生長條圖。
$(document).on("gkComponentsReady", function () {
  var data = [{
    label: 'Games',
    data: [
      ['Games', 32]
    ]
  }, {
    label: 'Facebook',
    data: [
      ['Facebook', 17]
    ]
  }, {
    label: 'Browser',
    data: [
      ['Browser', 14]
    ]
  }, {
    label: 'Social Messaging',
    data: [
      ['Social Messaging', 9.5]
    ]
  }, {
    label: 'YouTube',
    data: [
      ['YouTube', 4]
    ]
  }, {
    label: 'Entertainment',
    data: [
      ['Entertainment', 4]
    ]
  }, {
    label: 'Utilities',
    data: [
      ['Utilities', 8]
    ]
  }, {
    label: 'News',
    data: [
      ['News', 3]
    ]
  }, {
    label: 'Other',
    data: [
      ['Other', 8.5]
    ]
  }];

  $('#gk-109BFPk').gk('render', data);
});
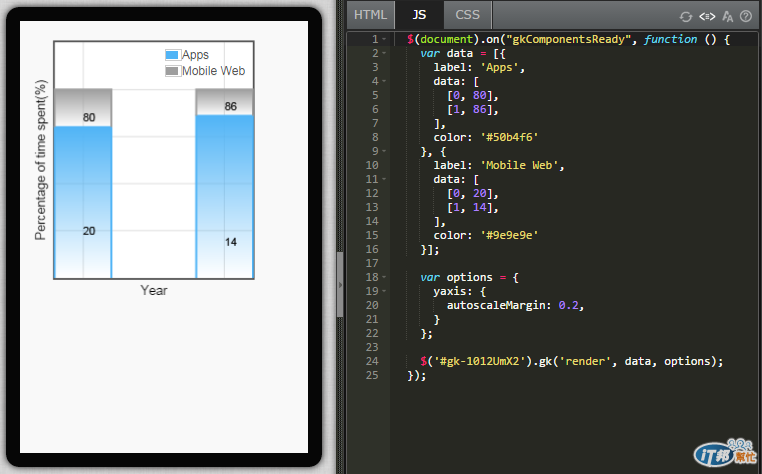
3. flot-stacking

( 範例,點選 preview 預覽:http://jqmdesigner.appspot.com/designer.html#&ref=5716829431398400 )
另外一種長條圖,就是長條圖內會分段,可以做多種維度的呈現,同樣的,拖拉進入設計畫面之後會長出程式碼,自行塞入 json 就可以囉!( 不過他所需要的 json 裡頭會包含陣列,畢竟是「分段」的長條圖呀 )
  $(document).on("gkComponentsReady", function () {
    var data = [{
      label: 'Apps',
      data: [
        [0, 80],
        [1, 86],
      ],
      color: '#50b4f6'
    }, {
      label: 'Mobile Web',
      data: [
        [0, 20],
        [1, 14],
      ],
      color: '#9e9e9e'
    }];

    var options = {
      yaxis: {
        autoscaleMargin: 0.2,
      }
    };

    $('#gk-109fZmj').gk('render', data, options);
  });
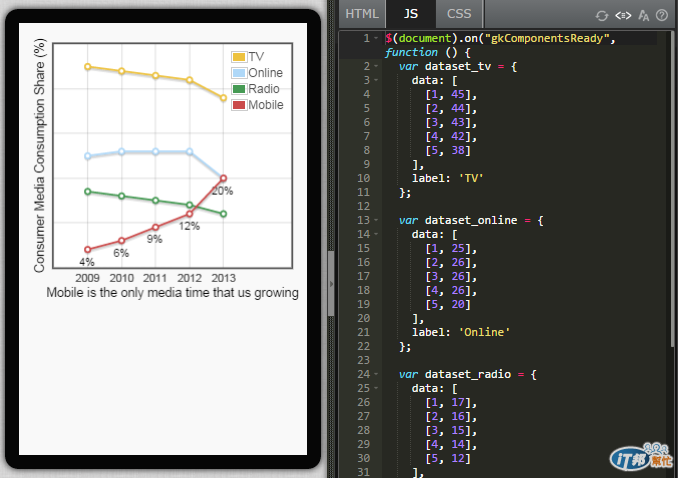
4. flot-line

( 範例,點選 preview 預覽:http://jqmdesigner.appspot.com/designer.html#&ref=5741862916718592 )
總算出現了折線圖,還以為 EZoApp 沒有提供呢哈哈!折線圖的用法其實跟剛剛講的圓餅圖長條圖都一樣,拖拉進入畫面後就會長出程式碼,自己填入 json 即可喔!而且藉由陣列的形式,就可以做出多條的長條圖,原理其實和 flot-stacking 類似。
$(document).on("gkComponentsReady", function () {
  var dataset_tv = {
    data: [
      [1, 45],
      [2, 44],
      [3, 43],
      [4, 42],
      [5, 38]
    ],
    label: 'TV'
  };

  var dataset_online = {
    data: [
      [1, 25],
      [2, 26],
      [3, 26],
      [4, 26],
      [5, 20]
    ],
    label: 'Online'
  };

  var dataset_radio = {
    data: [
      [1, 17],
      [2, 16],
      [3, 15],
      [4, 14],
      [5, 12]
    ],
    label: 'Radio',
    color: '#469a54'
  };

  var dataset_mobile = {
    data: [
      [1, 4],
      [2, 6],
      [3, 9],
      [4, 12],
      [5, 20]
    ],
    label: 'Mobile',
    labels: ["4%", "6%", "9%", "12%", "20%"]
  };

  var options = {
    xaxis: {
      autoscaleMargin: 0.5,
      ticks: [
        [1, 2009],
        [2, 2010],
        [3, 2011],
        [4, 2012],
        [5, 2013]
      ]
    }
  };

  $('#gk-109pNlg').gk('render', [dataset_tv, dataset_online, dataset_radio, dataset_mobile], options);
});
5. linechart

( 範例,點選 preview 預覽:http://jqmdesigner.appspot.com/designer.html#&ref=5731725451722752 )
最後一個圖表元件也是折線圖,不過因為沒有 flot 開頭,看起來就不是同一系列的,使用起來也是,個人是覺得還是上面的 flot-line 好看,但用法上是差不多啦!
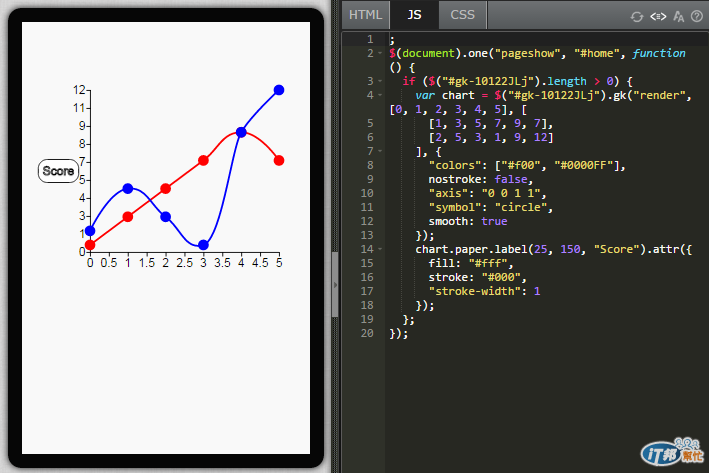
;
$(document).one("pageshow", "#home", function () {
  if ($("#gk-109sS5V").length > 0) {
    var chart = $("#gk-109sS5V").gk("render", [0, 1, 2, 3, 4, 5], [
      [1, 3, 5, 7, 9, 7],
      [2, 5, 3, 1, 9, 12]
    ], {
      "colors": ["#f00", "#0000FF"],
      nostroke: false,
      "axis": "0 0 1 1",
      "symbol": "circle",
      smooth: true
    });
    chart.paper.label(25, 150, "Score").attr({
      fill: "#fff",
      stroke: "#000",
      "stroke-width": 1
    });
  };
});
明天即將會介紹與手機硬體有關的元件囉!