回到先前的專案,將以爬出第二層的留言資料的行政區加以整理,檢視各行政區對公共議題的討論程度.
處理為
library(xml2)
#
web.url="https://join.gov.tw"
wdpath=paste0(getwd(),"/Documents/")

#[讀取]先前第二層資料
rowdfl<-read.csv(paste0(wdpath,"/dscsv/rowdata.csv"))
#處理行政區地理位置 自政府資料開放平臺取得的資料
dfp2g<-read.csv(paste0(wdpath,"/dscsv/Post2geo.csv"))
資料整理
#僅需要行政區與計數資料處理為rowdfl2
rowdfl2<-data.frame(cityarea=paste0(rowdfl$city,rowdfl$area),count=1)
#行政地理區資料整理
dfp2g<-subset(dfp2g,select = c(-1,-3,-6))
names(dfp2g)<-c("cityarea","lon","lat")
View(rowdfl2)
View(dfp2g)
dfsumca 處理明細資料行政區的加總
dfcageo 處理加總後的資料串接地理位置
dfsumca<-aggregate(count~cityarea,data=rowdfl2,FUN=sum)
View(dfsumca)
#
dfcageo<-merge(dfp2g,dfsumca,by="cityarea")
View(dfcageo)
#做另一個僅取前20的df
#order(dfcageo$count,decreasing = TRUE) 先排序
#head(df,20) 取前20
#df[head(df,20),] 調整為新的row/col

dfcageo20<-dfcageo[head(order(dfcageo$count,decreasing = TRUE),20),]
View(dfcageo20)
處理ggmap畫圖
相關的畫圖語法,同ggplot操作
library(ggmap)
map<-get_map(
  #location = c(lon=121.5199,lat=25.03240),#台北市中正區的位置當中心
  location = 'Taiwan',#台灣地圖整個當中心
  zoom=8)#1-15
ggmap(map)

#全部資料
ggmap(map)+geom_point(aes(x=lon,y=lat,size=count),data=dfcageo)
#TOP20
ggmap(map)+geom_point(aes(x=lon,y=lat,size=count),data=dfcageo20)
切換地圖中心位置與尺寸會有不同的效果
全部資料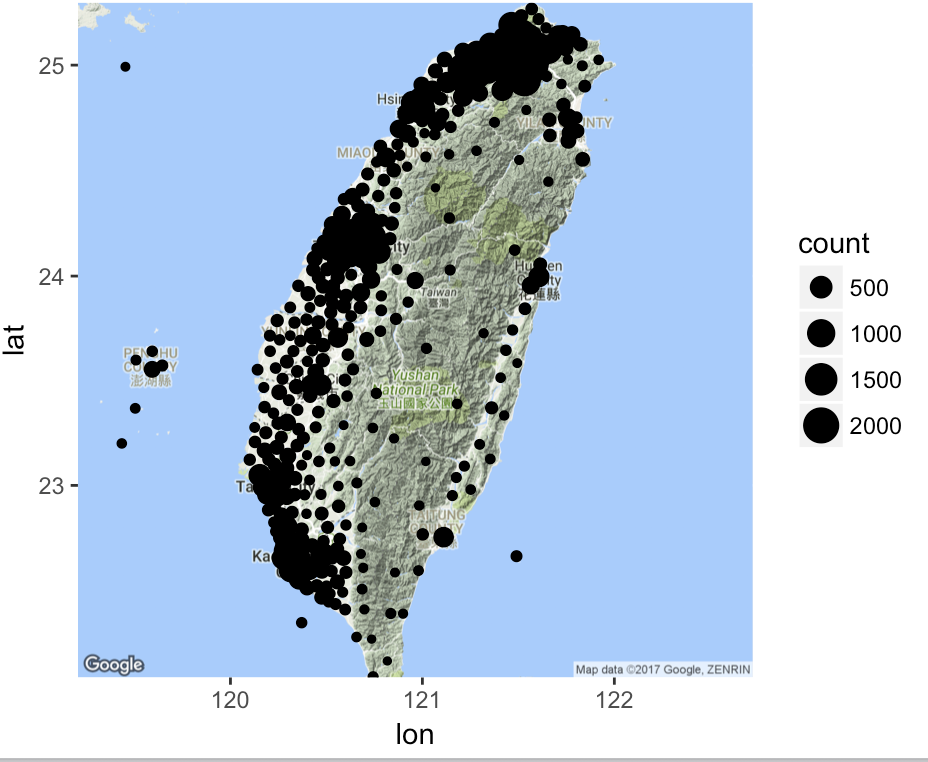
top20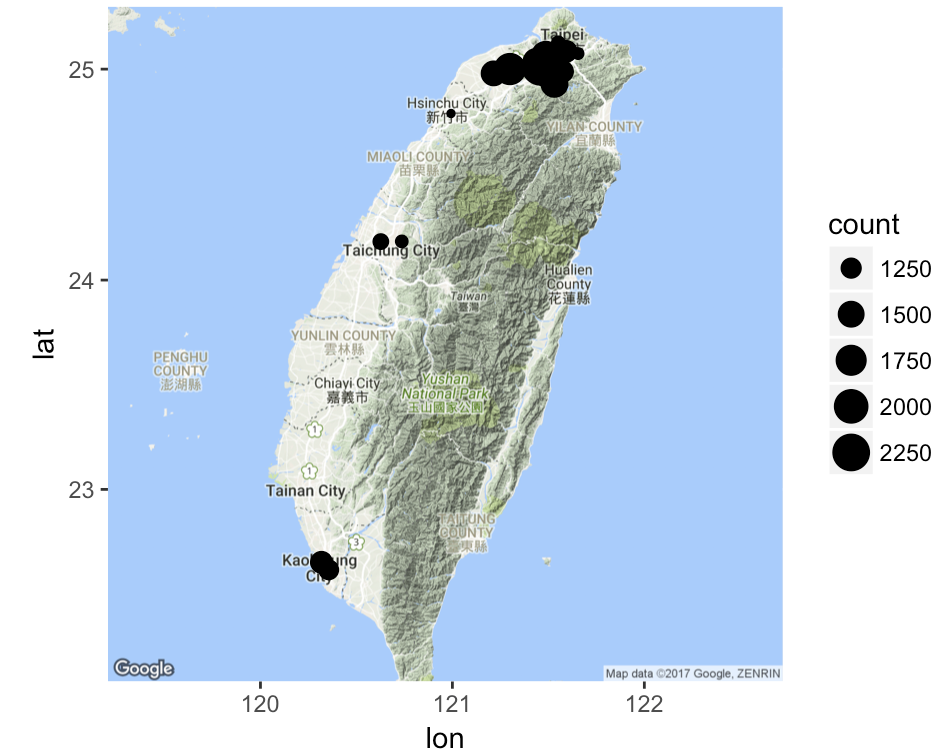
會有錯誤訊息告知有資料點是放不下的
Warning message:
Removed 345 rows containing missing
values (geom_point).


 iThome鐵人賽