想預測自己玩張的瀏覽人次,請前往https://ithome-predict-browse-count.herokuapp.com/index/<你的文章的網頁連結>,舉例來說https://ithome-predict-browse-count.herokuapp.com/index/https://ithelp.ithome.com.tw/articles/10195825/。
雖然30天已經寫完,不過之前承諾過大家要預測ithome鐵人文章的瀏覽人次,因此又多了這篇讓大家玩玩。
import os
import pandas as pd
import jieba
jieba.set_dictionary('dict.txt.big')
with open('stops.txt', 'r', encoding='utf8') as f:
    stops = f.read().split('\n')

import numpy as np
import json
import matplotlib.pyplot as plt
from sklearn.preprocessing import MultiLabelBinarizer, LabelEncoder

from datetime import datetime
starttime= datetime.now()
我已經連續爬了15天的所有貼文並存成csv檔。
files = [os.path.join('articles', i) for i in os.listdir("articles")]

df = pd.DataFrame()
for f in files:
    df_part = pd.read_csv(f)
    df = pd.concat([df, df_part], ignore_index=True)

df["publish_datetime"] = df["publish_datetime"].apply(pd.to_datetime)
df["crawled_date"] = df["crawled_date"].apply(pd.to_datetime)

for h in ['h1', 'h2', 'h3', 'h4', 'h5', 'h6']:
    df.loc[pd.notnull(df[h]), h] = df.loc[pd.notnull(df[h]), h].apply(eval)

print(len(df))
print(datetime.now()-starttime)
LabelEncoder可以幫你把類別資料轉成數值型類別。如果每一筆資料有多個標籤,MultiLabelBinarizer則會幫你自動將其Onehot Encoding,這邊把一個詞當作一個標籤,不過因為這邊詞量太大,如果用Onehot可能會有記憶體不足的狀況,因此這邊先使用索引值編碼就好,這也就是為甚麼要寫getidxs function。另外,我把發文後到被我爬下來的時間長轉成小時。
le_group = LabelEncoder()
le_group.fit(df['group'])

le_corpus_day = LabelEncoder()
max_corpus_day = df['corpus_day'].max()
le_corpus_day.fit(df['corpus_day'])

mlb = MultiLabelBinarizer()
term_idx_mapping = {}

def preprocess(df, train=True):
    df.fillna('None', inplace=True)
    df[df['corpus_day'] > max_corpus_day] = max_corpus_day  ## for testing purpose

    def preprocess_applyfun(row):
        # combine all headers
        header = ""
        for h in ['h1', 'h2', 'h3', 'h4', 'h5', 'h6']:
            if row[h] != "None":
                header += " ".join(row[h]) + "\n"

        # Tokenize
        row['article_title'] = [w for w in jieba.cut(row['article_title'], cut_all=True)]
        row['corpus_title'] = [w for w in jieba.cut(row['corpus_title'], cut_all=True)]
        row['header'] = [w for w in jieba.cut(header, cut_all=True)]
        row['text_content'] = [w for w in jieba.cut(row['text_content'], cut_all=True) if w not in stops]
        # cal_publish_hours
        timedelta = row['crawled_date'] - row['publish_datetime']
        row['publish_hours'] = timedelta.days * 24 + timedelta.seconds // 3600
        # group and corpus_day categorilize
        row['group'] = le_group.transform([row['group']])[0]
        row['corpus_day'] = le_corpus_day.transform([row['corpus_day']])[0]

        return row
    df = df.apply(preprocess_applyfun, axis=1)

    if train:
        mlb.fit(np.hstack([df['article_title'], df['corpus_title'], df['header'], df['text_content']]))
        for idx, term in enumerate(mlb.classes_):
            term_idx_mapping[term] = idx

    # Serialize tokens
    def getidxs(terms):
        idxs = []
        for term in terms:
            if term in term_idx_mapping.keys():
                idx = term_idx_mapping.get(term)
                idxs.append(idx)
        return idxs
    df['article_title'] = df['article_title'].apply(getidxs)
    df['corpus_title'] = df['corpus_title'].apply(getidxs)
    df['header'] = df['header'].apply(getidxs)
    df['text_content'] = df['text_content'].apply(getidxs)
    return df

df = preprocess(df)
print(datetime.now()-starttime)
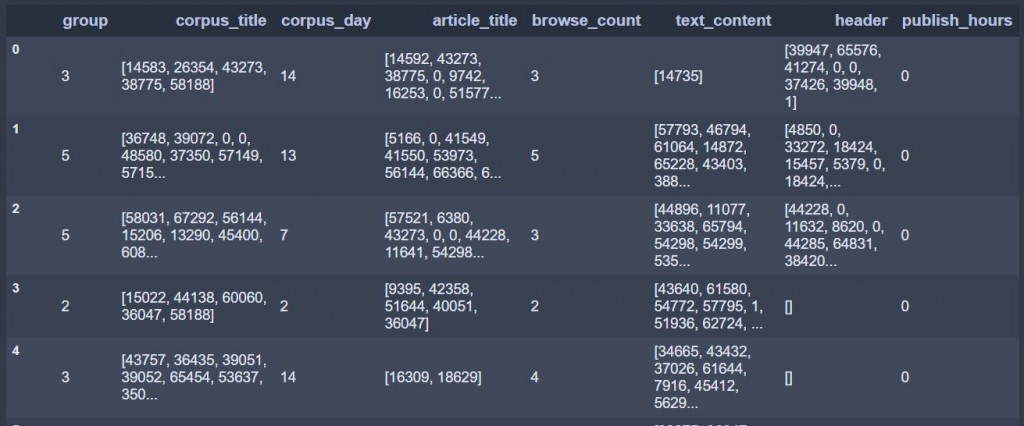
df[['group', 'corpus_title', 'corpus_day', 'article_title', 'browse_count',
     'text_content', 'header', 'publish_hours']]

#EXTRACT DEVELOPTMENT TEST
from sklearn.model_selection import train_test_split
dtrain, dvalid = train_test_split(df, random_state=233, train_size=0.90)
print(dtrain.shape)
print(dvalid.shape)

# (38325, 20)
# (4259, 20)
article_title, corpus_title, header, text_content這四個欄位已經被轉換成索引值,但是長度並不一,因此要填上零,讓他們等長,下面pad_sequence會用到。至於MAX_TEXT, MAX_GROUP, MAX_CORPUS_DAY則是在Keras Input時告訴它總共分成幾類。
#EMBEDDINGS MAX VALUE
# print(df['article_title'].apply(len).max())
# print(df['corpus_title'].apply(len).max())
# print(df['header'].apply(len).max())
# print(df['text_content'].apply(len).max())

MAX_ARTICLE_TITLE_SEQ = 60 #60
MAX_CORPUS_TITLE_SEQ = 20 #22
MAX_HEADER_SEQ = 250 #260
MAX_TEXT_CONTENT_SEQ = 500 #1195

MAX_TEXT = len(term_idx_mapping) +1
MAX_GROUP = len(le_group.classes_)
MAX_CORPUS_DAY = len(le_corpus_day.classes_)

print(MAX_ARTICLE_TITLE_SEQ)  # 60
print(MAX_CORPUS_TITLE_SEQ)  # 20
print(MAX_HEADER_SEQ)  # 250
print(MAX_TEXT_CONTENT_SEQ)  # 500
print(MAX_TEXT)  # 67647
print(MAX_GROUP)  # 7
print(MAX_CORPUS_DAY)  # 34
print(datetime.now() - starttime)  # 0:16:17.879698
#KERAS DATA DEFINITION
from keras.preprocessing.sequence import pad_sequences

def get_keras_data(dataset):
    X = {
        "seq_article_title":pad_sequences(dataset['article_title'], maxlen=MAX_ARTICLE_TITLE_SEQ),
        "seq_corpus_title":pad_sequences(dataset['corpus_title'], maxlen=MAX_CORPUS_TITLE_SEQ),
        "seq_header":pad_sequences(dataset['header'], maxlen=MAX_HEADER_SEQ),
        "seq_text_content":pad_sequences(dataset['text_content'], maxlen=MAX_TEXT_CONTENT_SEQ),
        'group': np.array(dataset['group']),
        'corpus_day': np.array(dataset['corpus_day']),
        'publish_hours': np.array(dataset['publish_hours']),
    }
    return X

X_train = get_keras_data(dtrain)
X_valid = get_keras_data(dvalid)

print(datetime.now() - starttime)
這裡有用到Keras的MultiInput,其中跟文字相關的都使用RNN。
#KERAS MODEL DEFINITION
from keras.layers import Input, Dropout, Dense, BatchNormalization, \
    Activation, concatenate, GRU, Embedding, Flatten
from keras.models import Model
from keras.callbacks import ModelCheckpoint, Callback, EarlyStopping#, TensorBoard
from keras import backend as K
from keras import optimizers
from keras import initializers
def rmsle_cust(y_true, y_pred):
    first_log = K.log(K.clip(y_pred, K.epsilon(), None) + 1.)
    second_log = K.log(K.clip(y_true, K.epsilon(), None) + 1.)
    return K.sqrt(K.mean(K.square(first_log - second_log), axis=-1))

def get_model():
    #params
    dr = 0.20

    #Inputs
    seq_corpus_title = Input(shape=[X_train["seq_corpus_title"].shape[1]], name="seq_corpus_title")
    seq_article_title = Input(shape=[X_train["seq_article_title"].shape[1]], name="seq_article_title")
    seq_header = Input(shape=[X_train["seq_header"].shape[1]], name="seq_header")
    seq_text_content = Input(shape=[X_train["seq_text_content"].shape[1]], name="seq_text_content")
    group = Input(shape=[1], name="group")
    corpus_day = Input(shape=[1], name="corpus_day")
    publish_hours = Input(shape=[1], name="publish_hours")

    #Embeddings layers
    emb_corpus_title = Embedding(MAX_TEXT, 10)(seq_corpus_title)
    emb_article_title = Embedding(MAX_TEXT, 10)(seq_article_title)
    emb_header = Embedding(MAX_TEXT, 10)(seq_header)
    emb_text_content = Embedding(MAX_TEXT, 100)(seq_text_content)

    emb_group = Embedding(MAX_GROUP, 5)(group)
    emb_corpus_day = Embedding(MAX_CORPUS_DAY, 10)(corpus_day)

    rnn_layer1 = GRU(8) (emb_corpus_title)
    rnn_layer2 = GRU(8) (emb_article_title)
    rnn_layer3 = GRU(8) (emb_header)
    rnn_layer4 = GRU(16) (emb_text_content)

    #main layer
    main_l = concatenate([
        rnn_layer1,
        rnn_layer2,
        rnn_layer3,
        rnn_layer4,
        Flatten() (emb_group),
        Flatten() (emb_corpus_day),
        publish_hours
    ])
    main_l = Dropout(dr)(Dense(512,activation='relu') (main_l))
    main_l = Dropout(dr)(Dense(64,activation='relu') (main_l))
    main_l = Dropout(dr)(Dense(32,activation='relu') (main_l))

    #output
    output = Dense(1, activation="linear") (main_l)

    #model
    model = Model([ seq_corpus_title, seq_article_title, seq_header,
                   seq_text_content, group, corpus_day, publish_hours], output)

    #optimizer = optimizers.RMSprop()
    optimizer = optimizers.Adam()
    model.compile(loss="mse", optimizer=optimizer, metrics=["mae"])
    return model

model = get_model()
model.summary()
_______________________________________________________________________________________________
Layer (type)                    Output Shape         Param #     Connected to
===============================================================================================
seq_corpus_title (InputLayer)   (None, 20)           0
_______________________________________________________________________________________________
seq_article_title (InputLayer)  (None, 60)           0
_______________________________________________________________________________________________
seq_header (InputLayer)         (None, 250)          0
_______________________________________________________________________________________________
seq_text_content (InputLayer)   (None, 500)          0
_______________________________________________________________________________________________
group (InputLayer)              (None, 1)            0
_______________________________________________________________________________________________
corpus_day (InputLayer)         (None, 1)            0
_______________________________________________________________________________________________
embedding_1 (Embedding)         (None, 20, 10)       676470      seq_corpus_title[0][0]
_______________________________________________________________________________________________
embedding_2 (Embedding)         (None, 60, 10)       676470      seq_article_title[0][0]
_______________________________________________________________________________________________
embedding_3 (Embedding)         (None, 250, 10)      676470      seq_header[0][0]
_______________________________________________________________________________________________
embedding_4 (Embedding)         (None, 500, 100)     6764700     seq_text_content[0][0]
_______________________________________________________________________________________________
embedding_5 (Embedding)         (None, 1, 5)         35          group[0][0]
_______________________________________________________________________________________________
embedding_6 (Embedding)         (None, 1, 10)        340         corpus_day[0][0]
_______________________________________________________________________________________________
gru_1 (GRU)                     (None, 8)            456         embedding_1[0][0]
_______________________________________________________________________________________________
gru_2 (GRU)                     (None, 8)            456         embedding_2[0][0]
_______________________________________________________________________________________________
gru_3 (GRU)                     (None, 8)            456         embedding_3[0][0]
_______________________________________________________________________________________________
gru_4 (GRU)                     (None, 16)           5616        embedding_4[0][0]
_______________________________________________________________________________________________
flatten_1 (Flatten)             (None, 5)            0           embedding_5[0][0]
_______________________________________________________________________________________________
flatten_2 (Flatten)             (None, 10)           0           embedding_6[0][0]
_______________________________________________________________________________________________
publish_hours (InputLayer)      (None, 1)            0
_______________________________________________________________________________________________
concatenate_1 (Concatenate)     (None, 56)           0           gru_1[0][0]
                                                                 gru_2[0][0]
                                                                 gru_3[0][0]
                                                                 gru_4[0][0]
                                                                 flatten_1[0][0]
                                                                 flatten_2[0][0]
                                                                 publish_hours[0][0]
_______________________________________________________________________________________________
dense_1 (Dense)                 (None, 512)          29184       concatenate_1[0][0]
_______________________________________________________________________________________________
dropout_1 (Dropout)             (None, 512)          0           dense_1[0][0]
_______________________________________________________________________________________________
dense_2 (Dense)                 (None, 64)           32832       dropout_1[0][0]
_______________________________________________________________________________________________
dropout_2 (Dropout)             (None, 64)           0           dense_2[0][0]
_______________________________________________________________________________________________
dense_3 (Dense)                 (None, 32)           2080        dropout_2[0][0]
_______________________________________________________________________________________________
dropout_3 (Dropout)             (None, 32)           0           dense_3[0][0]
_______________________________________________________________________________________________
dense_4 (Dense)                 (None, 1)            33          dropout_3[0][0]
===============================================================================================
Total params: 8,865,
Trainable params: 8,865,
Non-trainable params
_______________________________________________________________________________________________
gc用來節省記憶體空間,然後就用Model去fit。
import gc
gc.collect()
#FITTING THE MODEL
epochs = 5
BATCH_SIZE = 512 * 3
steps = int(len(X_train)/BATCH_SIZE) * epochs
lr_init, lr_fin = 0.017, 0.009
exp_decay = lambda init, fin, steps: (init/fin)**(1/(steps-1)) - 1
lr_decay = exp_decay(lr_init, lr_fin, steps)

model = get_model()
K.set_value(model.optimizer.lr, lr_init)
K.set_value(model.optimizer.decay, lr_decay)

history = model.fit(X_train, dtrain.browse_count
                    , epochs=epochs
                    , batch_size=BATCH_SIZE
#                     , validation_split=0.1
                    , validation_data=(X_valid, dvalid.browse_count)
                    , verbose=1
                    )

print(datetime.now() - starttime)
Train on 38325 samples, validate on 4259 samples
Epoch 1/5
38325/38325 [===========] - 209s 5ms/step - loss: 1026696.9060 - mean_absolute_error: 220.6634 - val_loss: 566747.7857 - val_mean_absolute_error: 162.5117
Epoch 2/5
38325/38325 [===========] - 182s 5ms/step - loss: 790294.7851 - mean_absolute_error: 189.1313 - val_loss: 133049.8886 - val_mean_absolute_error: 159.8171
Epoch 3/5
38325/38325 [===========] - 203s 5ms/step - loss: 549999.5994 - mean_absolute_error: 204.5251 - val_loss: 262894.7622 - val_mean_absolute_error: 143.3210
Epoch 4/5
38325/38325 [===========] - 230s 6ms/step - loss: 431161.4882 - mean_absolute_error: 173.1293 - val_loss: 123154.7756 - val_mean_absolute_error: 150.0321
Epoch 5/5
38325/38325 [===========] - 226s 6ms/step - loss: 234846.9607 - mean_absolute_error: 161.3210 - val_loss: 85303.8106 - val_mean_absolute_error: 121.6386
1:04:58.245270
from sklearn.metrics import mean_squared_error
def getdiff(model, valid=True):
    df = pd.DataFrame(dvalid['browse_count'].values, columns=['browse_count_true'])
    df['browse_count_pred'] = (model.predict(X_valid))
    return df

df_diff = getdiff(model)
mse =  mean_squared_error(df_diff['browse_count_true'].values, df_diff['browse_count_pred'].values)
print(mse)

# Plot outputs
mpl.rcParams['figure.figsize'] = 10, 5
df_diff_sorted = df_diff.sort_values('browse_count_true')
plt.scatter(range(len(df_diff_sorted)), df_diff_sorted['browse_count_true'].values, color='black', s=0.5)
plt.scatter(range(len(df_diff_sorted)), df_diff_sorted['browse_count_pred'].values, color='red', s=0.5)

plt.show()
df_diff

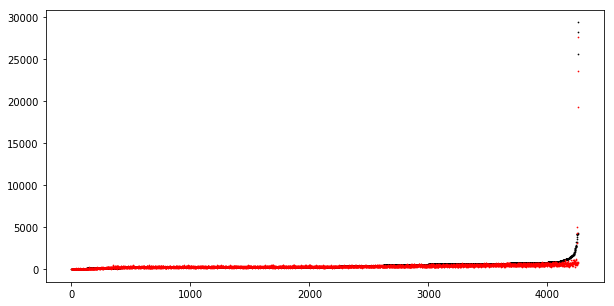
紅色的部分是預測值,黑色的部分是實際值。在比較低點的時候普遍來說不會差距太大,不過也有比例尺因素在裡面啦(笑),在瀏覽人次比較高的地方的時候,預測的誤差就相對就多了,不過還是會有著比低點來的高的預測瀏覽量。
| idx | browse_count_true | browse_count_pred |
|---|---|---|
| 0 | 271 | 272.936371 |
| 1 | 256 | 259.646454 |
| 2 | 849 | 720.042664 |
| 3 | 305 | 291.747192 |
| 4 | 208 | 259.776764 |
| 5 | 222 | 237.322327 |
| 6 | 209 | 217.769241 |
| 7 | 342 | 271.587341 |
| 8 | 67 | 37.776466 |
| 9 | 254 | 249.315750 |
| 10 | 583 | 345.432556 |
| 11 | 630 | 456.542908 |
| 12 | 694 | 467.314087 |
| 13 | 249 | 327.678284 |
| 14 | 822 | 755.098511 |
| 15 | 229 | 180.495590 |
| 16 | 316 | 361.333923 |
| 17 | 409 | 305.247406 |
| 18 | 571 | 415.976074 |
| 19 | 390 | 302.599060 |
| 20 | 113 | 76.910370 |
import requests
from bs4 import BeautifulSoup
import re

import os
import pandas as pd
import jieba
jieba.set_dictionary('dict.txt.big')
with open('stops.txt', 'r', encoding='utf8') as f:
    stops = f.read().split('\n')

import numpy as np
import json
import matplotlib.pyplot as plt
import matplotlib
zhfont1 = matplotlib.font_manager.FontProperties(fname='simsun.ttf')  ## plt中文字
from sklearn.preprocessing import MultiLabelBinarizer, LabelEncoder

from datetime import datetime
def get_article_data(url):
    if not url.startswith("https://ithelp.ithome.com.tw/articles/"):
        assert "請給ithome文章的網址"

    row = {}
    res = requests.get(url)
    soup = BeautifulSoup(res.text, 'lxml')

    ## group
    group = soup.select(".qa-header")[0].find_all('a')[0].text.replace(' ', '').replace('\n', '')

    ## linke count
    like_count = int(soup.select('.likeGroup__num')[0].text)  ## 定位讚的次數

    ## article header
    header = soup.select('.qa-header')[0]
    corpusinfo = header.select('h3')[0].text.replace(' ', '').replace('\n', '')
    corpus_title = corpusinfo.split('第')[0]  ## 定位文章集的的主題
    corpus_day = int(re.findall(r'第[\d]+篇', corpusinfo)[0].replace('第', '').replace('篇', ''))  ## 定位參賽第幾天

    article_title = header.select('h2')[0].text.replace(' ', '').replace('\n', '')  ## 定位文章的title
    writer_name = header.select('.ir-article-info__name')[0].text.replace(' ', '').replace('\n', '')  ## 定位作者名稱
    writer_url = header.select('.ir-article-info__name')[0]['href']  ## 定位作者的個人資訊業面

    publish_date_str = header.select('.qa-header__info-time')[0]['title']  ## 定位發文日期,為了讓日期的格式被讀成python的datetime,所以做了下面很瑣碎的事
    date_items = pd.Series(publish_date_str.split(' ')[0].split('-') + publish_date_str.split(' ')[1].split(':')).astype(int)
    publish_datetime = datetime(date_items[0], date_items[1], date_items[2], date_items[3], date_items[4], date_items[5])

    browse_count = int(re.findall(r'[\d]+', header.select('.ir-article-info__view')[0].text)[0])  ## 定位瀏覽次數

    ## markdown_html
    markdown_html = soup.select('.markdown__style')[0]
    text_content = "\n".join([p.text for p in markdown_html.select('p')])  ## 定位所有文章的段落,這邊我懶得爬讀片跟程式碼了
    h1 = [h1.text for h1 in markdown_html.select('h1')]  ## 定位文章的標題們
    h2 = [h2.text for h2 in markdown_html.select('h2')]
    h3 = [h3.text for h3 in markdown_html.select('h3')]
    h4 = [h4.text for h4 in markdown_html.select('h4')]
    h5 = [h5.text for h5 in markdown_html.select('h5')]
    h6 = [h6.text for h6 in markdown_html.select('h6')]

    row['group'] = group
    row['like_count'] = like_count
    row['corpus_title'] = corpus_title
    row['corpus_day'] = corpus_day
    row['article_title'] = article_title
    row['writer_name'] = writer_name
    row['writer_url'] = writer_url
    row['publish_datetime'] = publish_datetime
    row['browse_count'] = browse_count

    row['text_content'] = text_content
    row['h1'] = h1 if h1 != [] else None
    row['h2'] = h2 if h2 != [] else None
    row['h3'] = h3 if h3 != [] else None
    row['h4'] = h4 if h4 != [] else None
    row['h5'] = h5 if h5 != [] else None
    row['h6'] = h6 if h6 != [] else None

    row['crawled_date'] = datetime.now()

    return row
這邊要手動輸入成預測頭十天的瀏覽量,所以不需要publish_hours這個欄位。
le_group = LabelEncoder()
le_group.classes_ = np.load('le_group.npy')
le_corpus_day = LabelEncoder()
le_corpus_day.classes_ = np.load('le_corpus_day.npy')
with open('term_idx_mapping.json', 'r', encoding='utf8') as f:
    term_idx_mapping = json.load(f)
with open('max_corpus_day', 'r', encoding='utf8') as f:
    max_corpus_day = int(f.read())
def preprocess(df):
    df.fillna('None', inplace=True)
    df[df['corpus_day'] > max_corpus_day] = max_corpus_day  ## for testing purpose

    def preprocess_applyfun(row):
        # combine all headers
        header = ""
        for h in ['h1', 'h2', 'h3', 'h4', 'h5', 'h6']:
            if row[h] != "None":
                header += " ".join(row[h]) + "\n"

        # Tokenize
        row['article_title'] = [w for w in jieba.cut(row['article_title'], cut_all=True)]
        row['corpus_title'] = [w for w in jieba.cut(row['corpus_title'], cut_all=True)]
        row['header'] = [w for w in jieba.cut(header, cut_all=True)]
        row['text_content'] = [w for w in jieba.cut(row['text_content'], cut_all=True) if w not in stops]
        # cal_publish_hours
#         timedelta = row['crawled_date'] - row['publish_datetime']
#         row['publish_hours'] = timedelta.days * 24 + timedelta.seconds // 3600
        # group and corpus_day categorilize
        row['group'] = le_group.transform([row['group']])[0]
        row['corpus_day'] = le_corpus_day.transform([row['corpus_day']])[0]

        return row
    df = df.apply(preprocess_applyfun, axis=1)

    # Serialize tokens
    def getidxs(terms):
        idxs = []
        for term in terms:
            if term in term_idx_mapping.keys():
                idx = term_idx_mapping.get(term)
                idxs.append(idx)
        return idxs
    df['article_title'] = df['article_title'].apply(getidxs)
    df['corpus_title'] = df['corpus_title'].apply(getidxs)
    df['header'] = df['header'].apply(getidxs)
    df['text_content'] = df['text_content'].apply(getidxs)
    return df
這邊大家可以自行更改url以預測你想預測那篇文章的瀏覽數。
from keras.models import load_model
model = load_model("20180105 1248.model")

MAX_ARTICLE_TITLE_SEQ = 60 #60
MAX_CORPUS_TITLE_SEQ = 20 #22
MAX_HEADER_SEQ = 250 #260
MAX_TEXT_CONTENT_SEQ = 500 #1195

url = "https://ithelp.ithome.com.tw/articles/10195707"
data = get_article_data(url)
df_test = pd.DataFrame([data] * 10)
for i in range(len(df_test)):
    df_test.loc[i, 'publish_hours'] = 24 * (i+1)
df_test = preprocess(df_test)

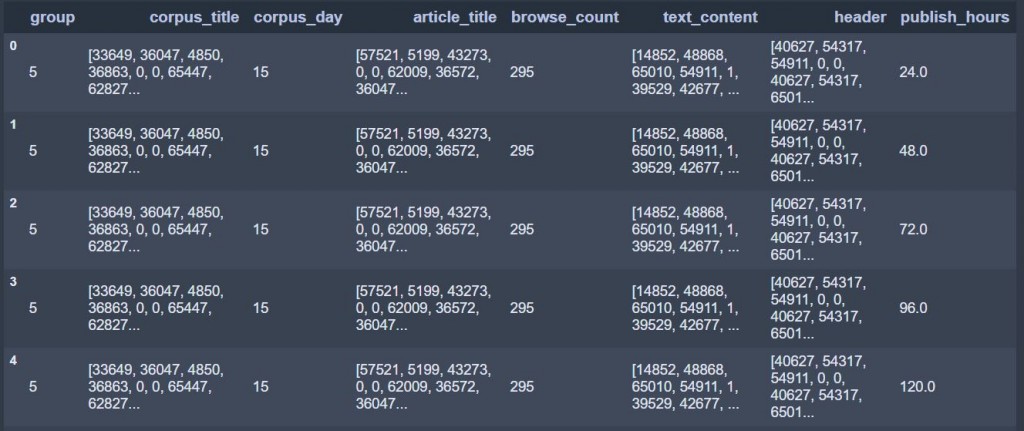
df_test[['group', 'corpus_title', 'corpus_day', 'article_title', 'browse_count',
     'text_content', 'header', 'publish_hours']]

#KERAS DATA DEFINITION
from keras.preprocessing.sequence import pad_sequences
def get_keras_data(dataset):
    X = {
        "seq_article_title":pad_sequences(dataset['article_title'], maxlen=MAX_ARTICLE_TITLE_SEQ),
        "seq_corpus_title":pad_sequences(dataset['corpus_title'], maxlen=MAX_CORPUS_TITLE_SEQ),
        "seq_header":pad_sequences(dataset['header'], maxlen=MAX_HEADER_SEQ),
        "seq_text_content":pad_sequences(dataset['text_content'], maxlen=MAX_TEXT_CONTENT_SEQ),
        'group': np.array(dataset['group']),
        'corpus_day': np.array(dataset['corpus_day']),
        'publish_hours': np.array(dataset['publish_hours']),
    }
    return X

X_test = get_keras_data(df_test)
predict_result = model.predict(X_test)
mpl.rcParams['figure.figsize'] = 10, 5
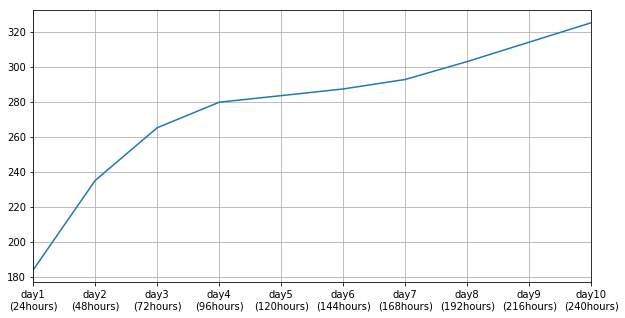
df_pred = pd.DataFrame(predict_result, index=['day'+str(i)+'\n('+ str(i*24) +'hours)' for i in range(1,11)], columns=[data['article_title']])
ax = df_pred.plot(kind='line', legend=False, figsize=(10, 5), grid=True)
plt.show()
df_pred.astype(int).T


