今天的主題是空間資料內插(interpolation),內插是GIS很重要的課題,因為我們拿到的資料(例如觀測站資料)很常是point,內插可以幫助我們把這些離散的資料變成面狀成果,這樣除了方便資料視覺化,也可以進一步進行空間分析。
內插有很多演算法,我們今天使用turf.js,在client端也可以做即時的內插運算,今天就試著來說明以下三種應用:
在開始之前,先補充說明,GIS內插方法在GIS已相當成熟,GIS軟體如 ArcGIS 、 QGIS 、 GRASS …等等老牌且強大的工具都有更進階的方法(Bilinear, Kriging, nearest neighbor),並且有較多參數可調整的工具可以使用,這邊以turf.js為例,是要說明在webGIS前端也可以使用內插^^。
IDW法概念很簡單,每個內插點(網格)的值與鄰近樣本點的關係是距離,距離越遠關係越小。所以取值點與樣本點間的距離為權重進行加權平均,離內插點越近的樣本點賦予的權重越大。
已知其坐標和值為Xi,Yi, Zi (i=1,2,3,4,5..)距離加權值求(Xp,Yp)點值,每個則Zp值以下公式。(gisgeography)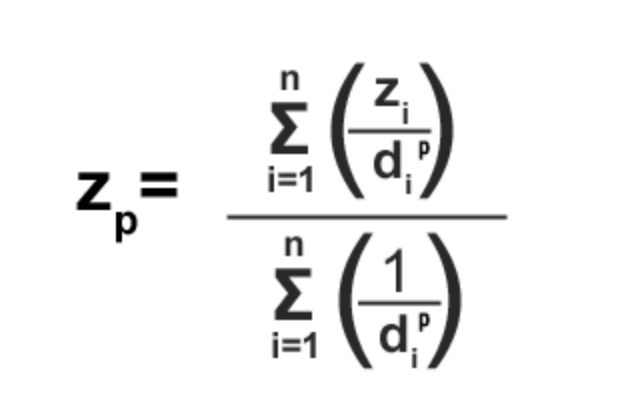
跟昨天一樣,我們先以randomPoint產生隨機點的點作為示範,並隨機給定一個觀測值obs:
//產生隨機點
var ramdompts_ipl = turf.randomPoint(25, { bbox: [121.41, 24.34, 121.8, 24.65] });
turf.featureEach(ramdompts_ipl, function (point) {
  point.properties.obs = Math.random() * 20;
});
ramdomLayer_ipl.addData(ramdompts_ipl).addTo(map);
map.fitBounds(ramdomLayer_ipl.getBounds());


//放入圖層
var ramdomLayer_ipl = L.geoJson(null, {
  pointToLayer: function (feature, latlng) {
    return L.marker(latlng, {
      icon: L.icon({
        iconUrl: "./dist/assets/img/icon-black.png",
        iconSize: [12, 12],
        iconAnchor: [0, 6]
      }),
    }).bindPopup(feature.properties.obs.toFixed(3).toString());
  }
});
在turf.js中,內插interpolate這個方法就是IDW法:
var idw_grid = turf.interpolate(ramdompts_ipl, 2, { gridType: 'hex', property: 'obs', units: 'kilometers' });
//成果會是geojson
interpolate有幾個參數,包含內插點的間距(2)、內插得值(obs)、間距的單位(kilometers)、以及gridType(turfjs)。
特別說明一gridType,目前有:'square' | 'point' | 'hex' | 'triangle' 可以選,例如本範例是用hex,輸出的成果就會是蜂巢狀的hexgrid。
除此之外,我們可能會使用square或triangle,因此這個方法是在規則的形狀中,計算內插值,只是格子不一定是方形的。
加入圖層,並給定色階:
var idw_gridLayer = L.geoJson(idw_grid, {
  onEachFeature: function (feature, layer) {
    layer.bindPopup(feature.properties.obs.toFixed(3).toString());
  },
  style: function (feature) {
    return {
      "color": getColor(feature.properties.obs),
      "opacity": 1,
    }
  }
}
).addTo(map);

//色階
function getColor(x) {
  return x < 5 ? '#bd0026' :
    x < 10 ? '#f03b20' :
      x < 15 ? '#fd8d3c' :
        x < 20 ? '#fecc5c' :
          '#ffffb2';
};
成果:
square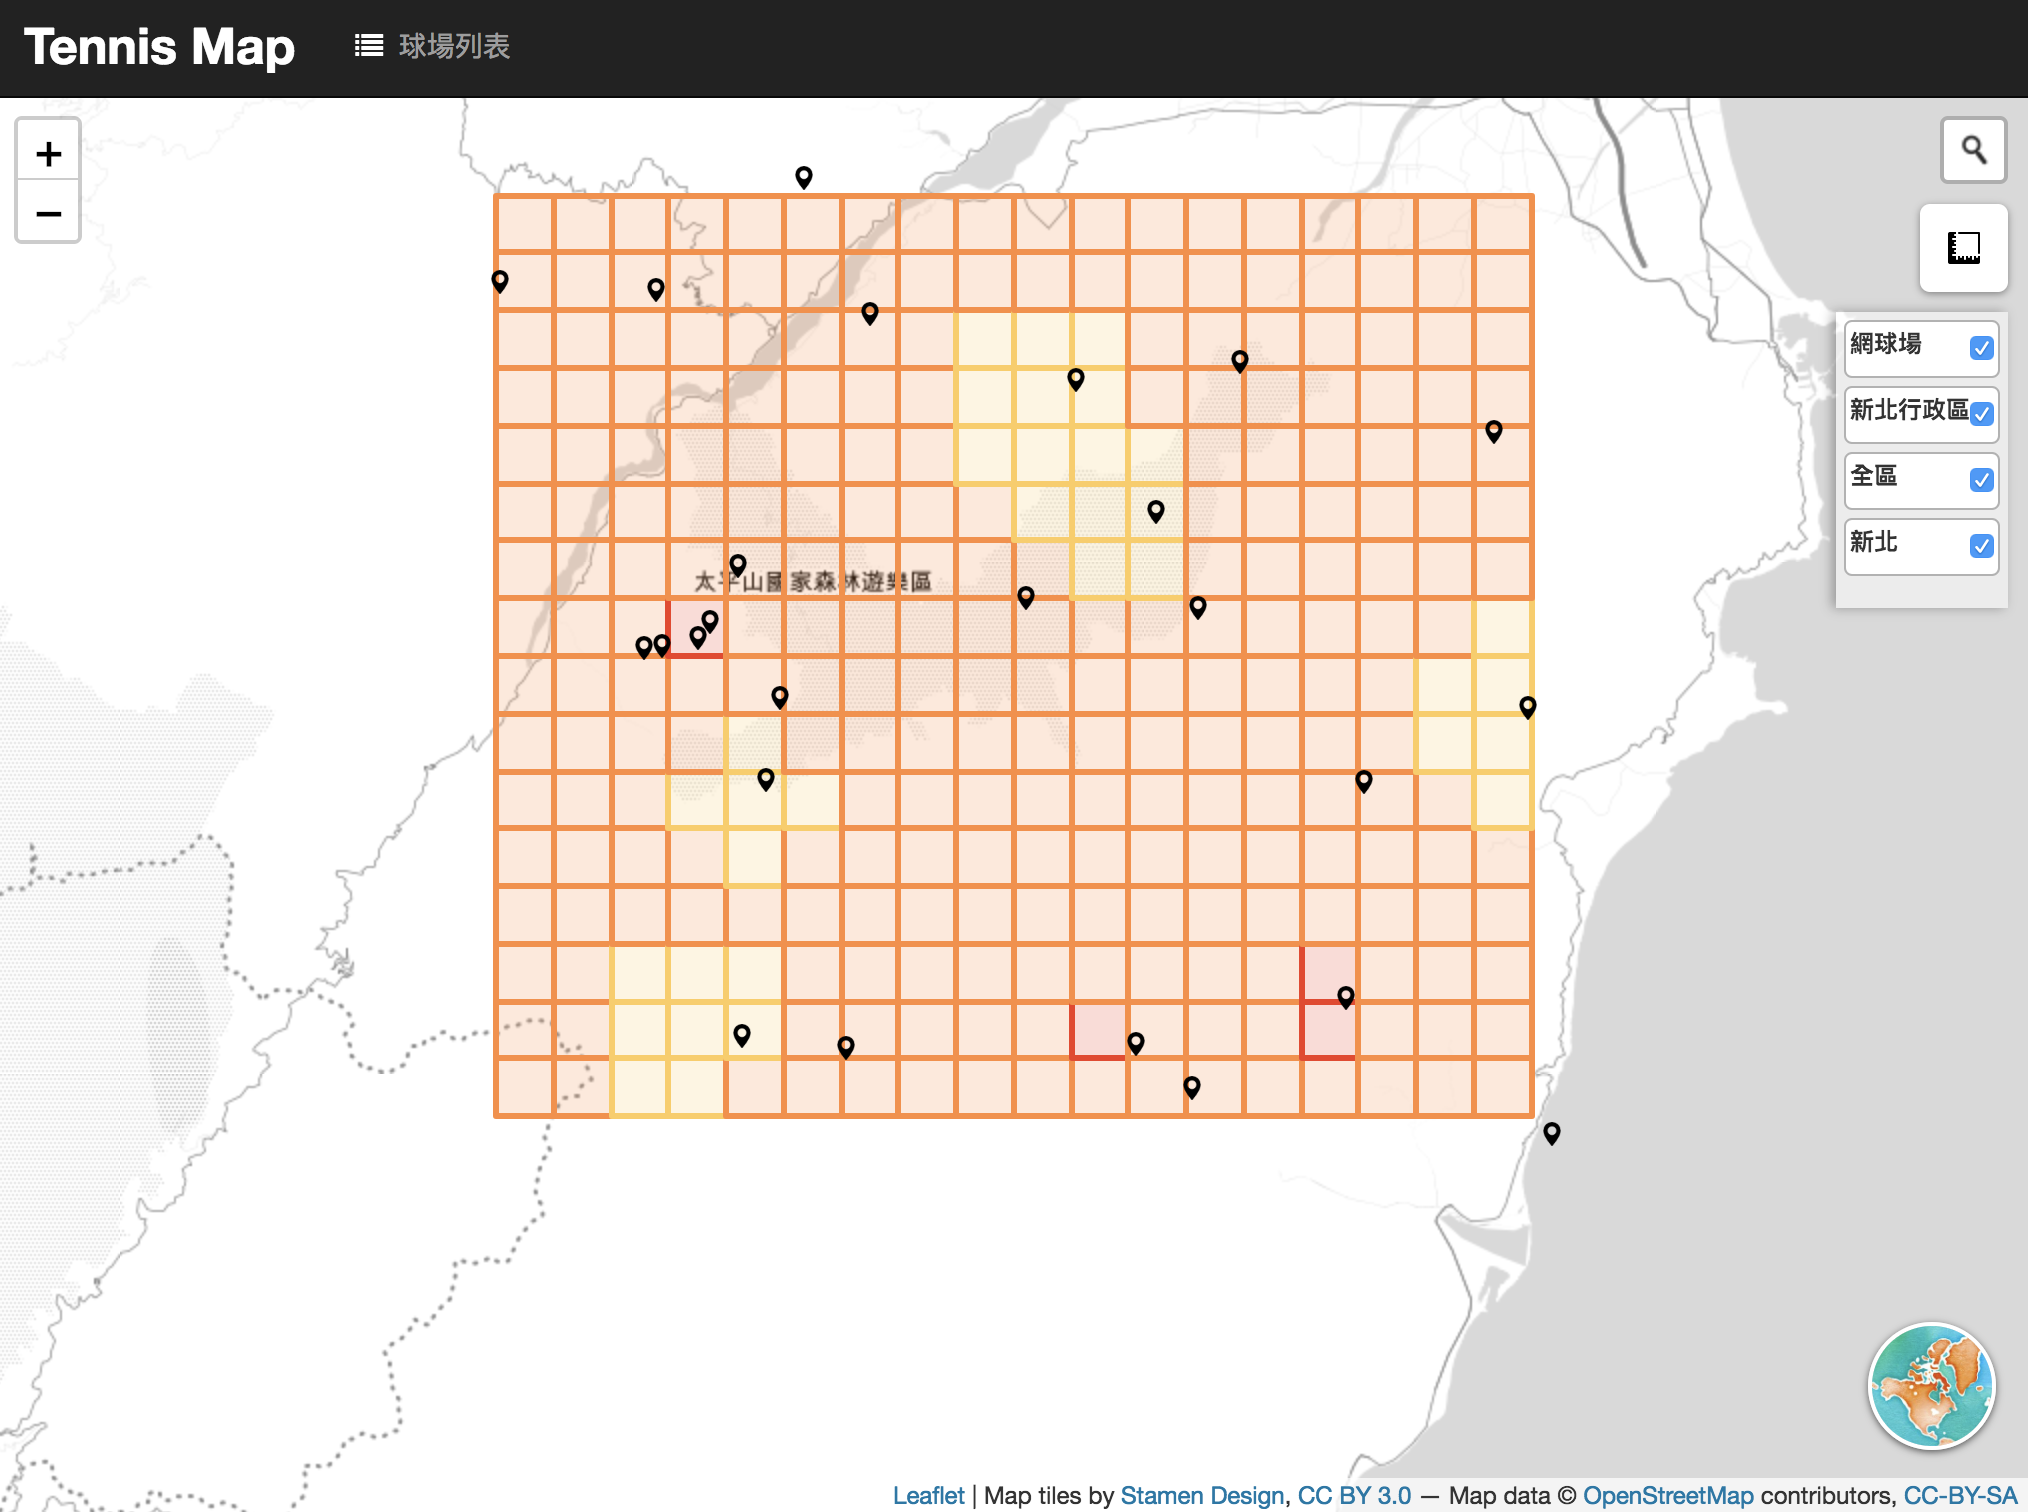
hex grid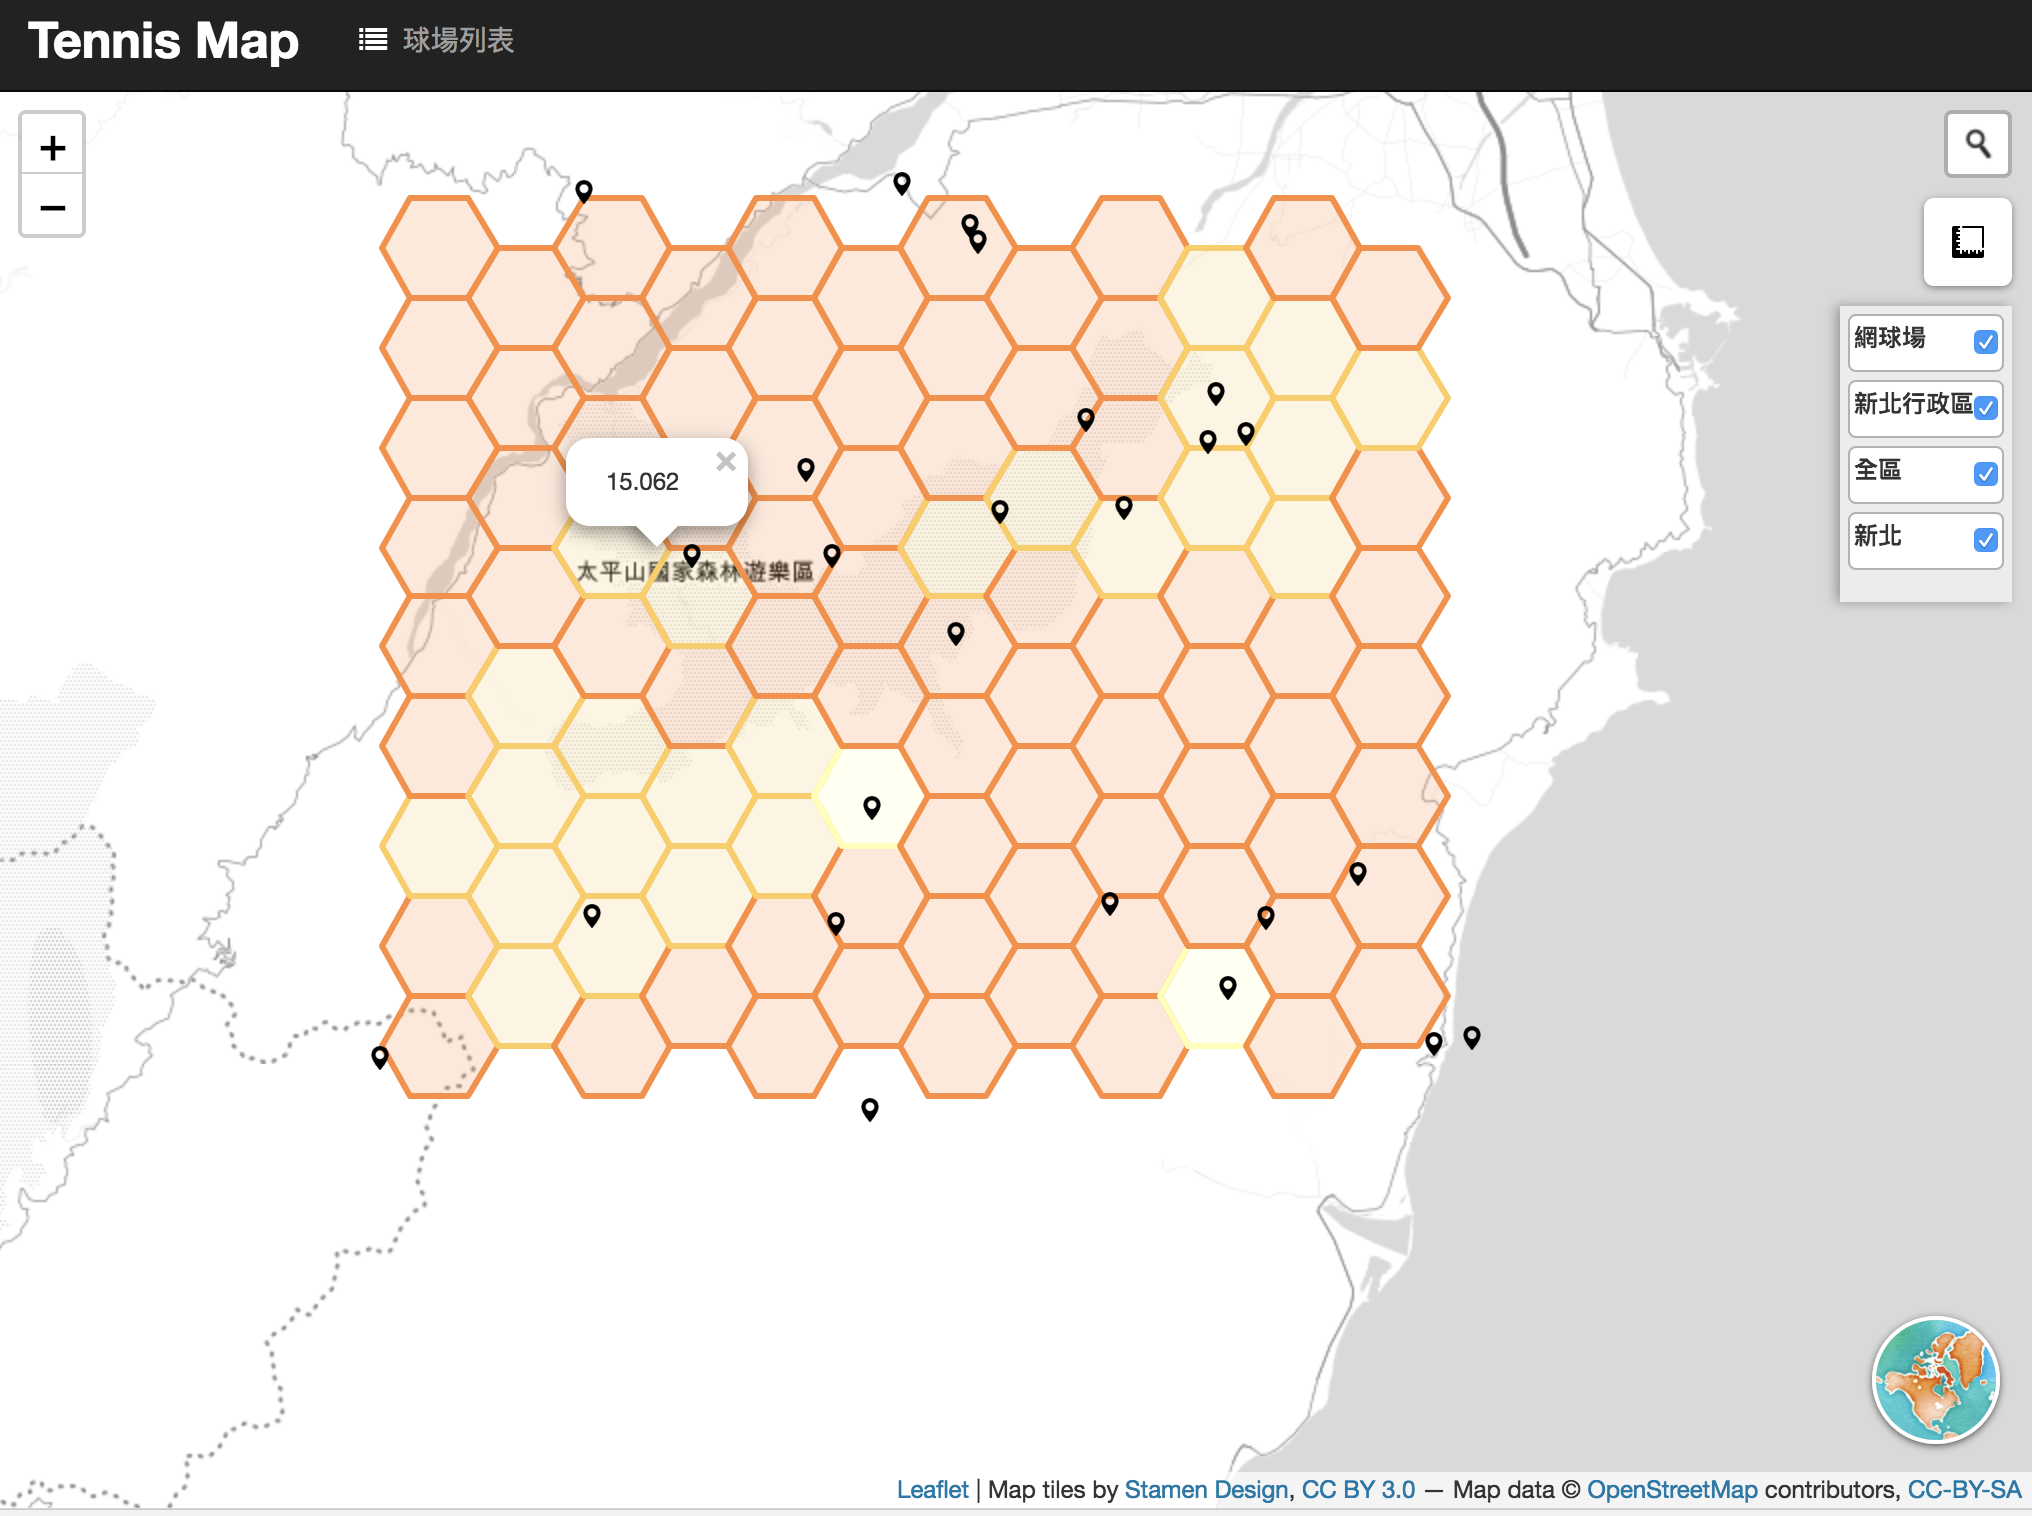
TIN是不規則三角網,在電腦視覺領域或是GIS都很常見,跟前面IDW法是內插在規則的形狀中有所不同,TIN組成的不規則三角網是將樣本點連成連續的三角網,而在眾多產生三角網的演算法中,Delaunay三角化是公認最佳解:
Delaunay三網化:資料中任三點取其外接圓,若此圓內沒有包含任何其它點,則這三角形加入三角網中。這樣的目的是讓三角形都能越接近正三角形,狹長得三角形出現機會越低,因為三角形三邊長若越接近,外接圓越小。
(wiki)
在turf中,產生TIN的方法也很簡單:
//把前面的隨機點拿來用用
var tin = turf.tin(ramdompts_ipl, 'obs');
加入圖層:
//放到圖層中
var tinLayer = L.geoJson(tin, {
  onEachFeature: function (feature, layer) {
    var obs = feature.properties.a + feature.properties.b + feature.properties.c;
    feature.properties.obs = obs / 3;
    layer.bindPopup(feature.properties.obs.toFixed(3).toString());
  },
  style: function (feature) {
    var obs = feature.properties.a + feature.properties.b + feature.properties.c;

    return {
      "fillColor": getColor(obs),
      "weight": 0.5,
      "color": '#bd0026',
      "opacity": 1,
    }
  }
}
).addTo(map);
其中,設定的obs為三角網三頂點要記錄的東西,每個三角形分別會記錄到a,b,c三個頂點,要進行內插,我們就組好TIN之後把三角形內的頂點取平均作為三角形的值囉。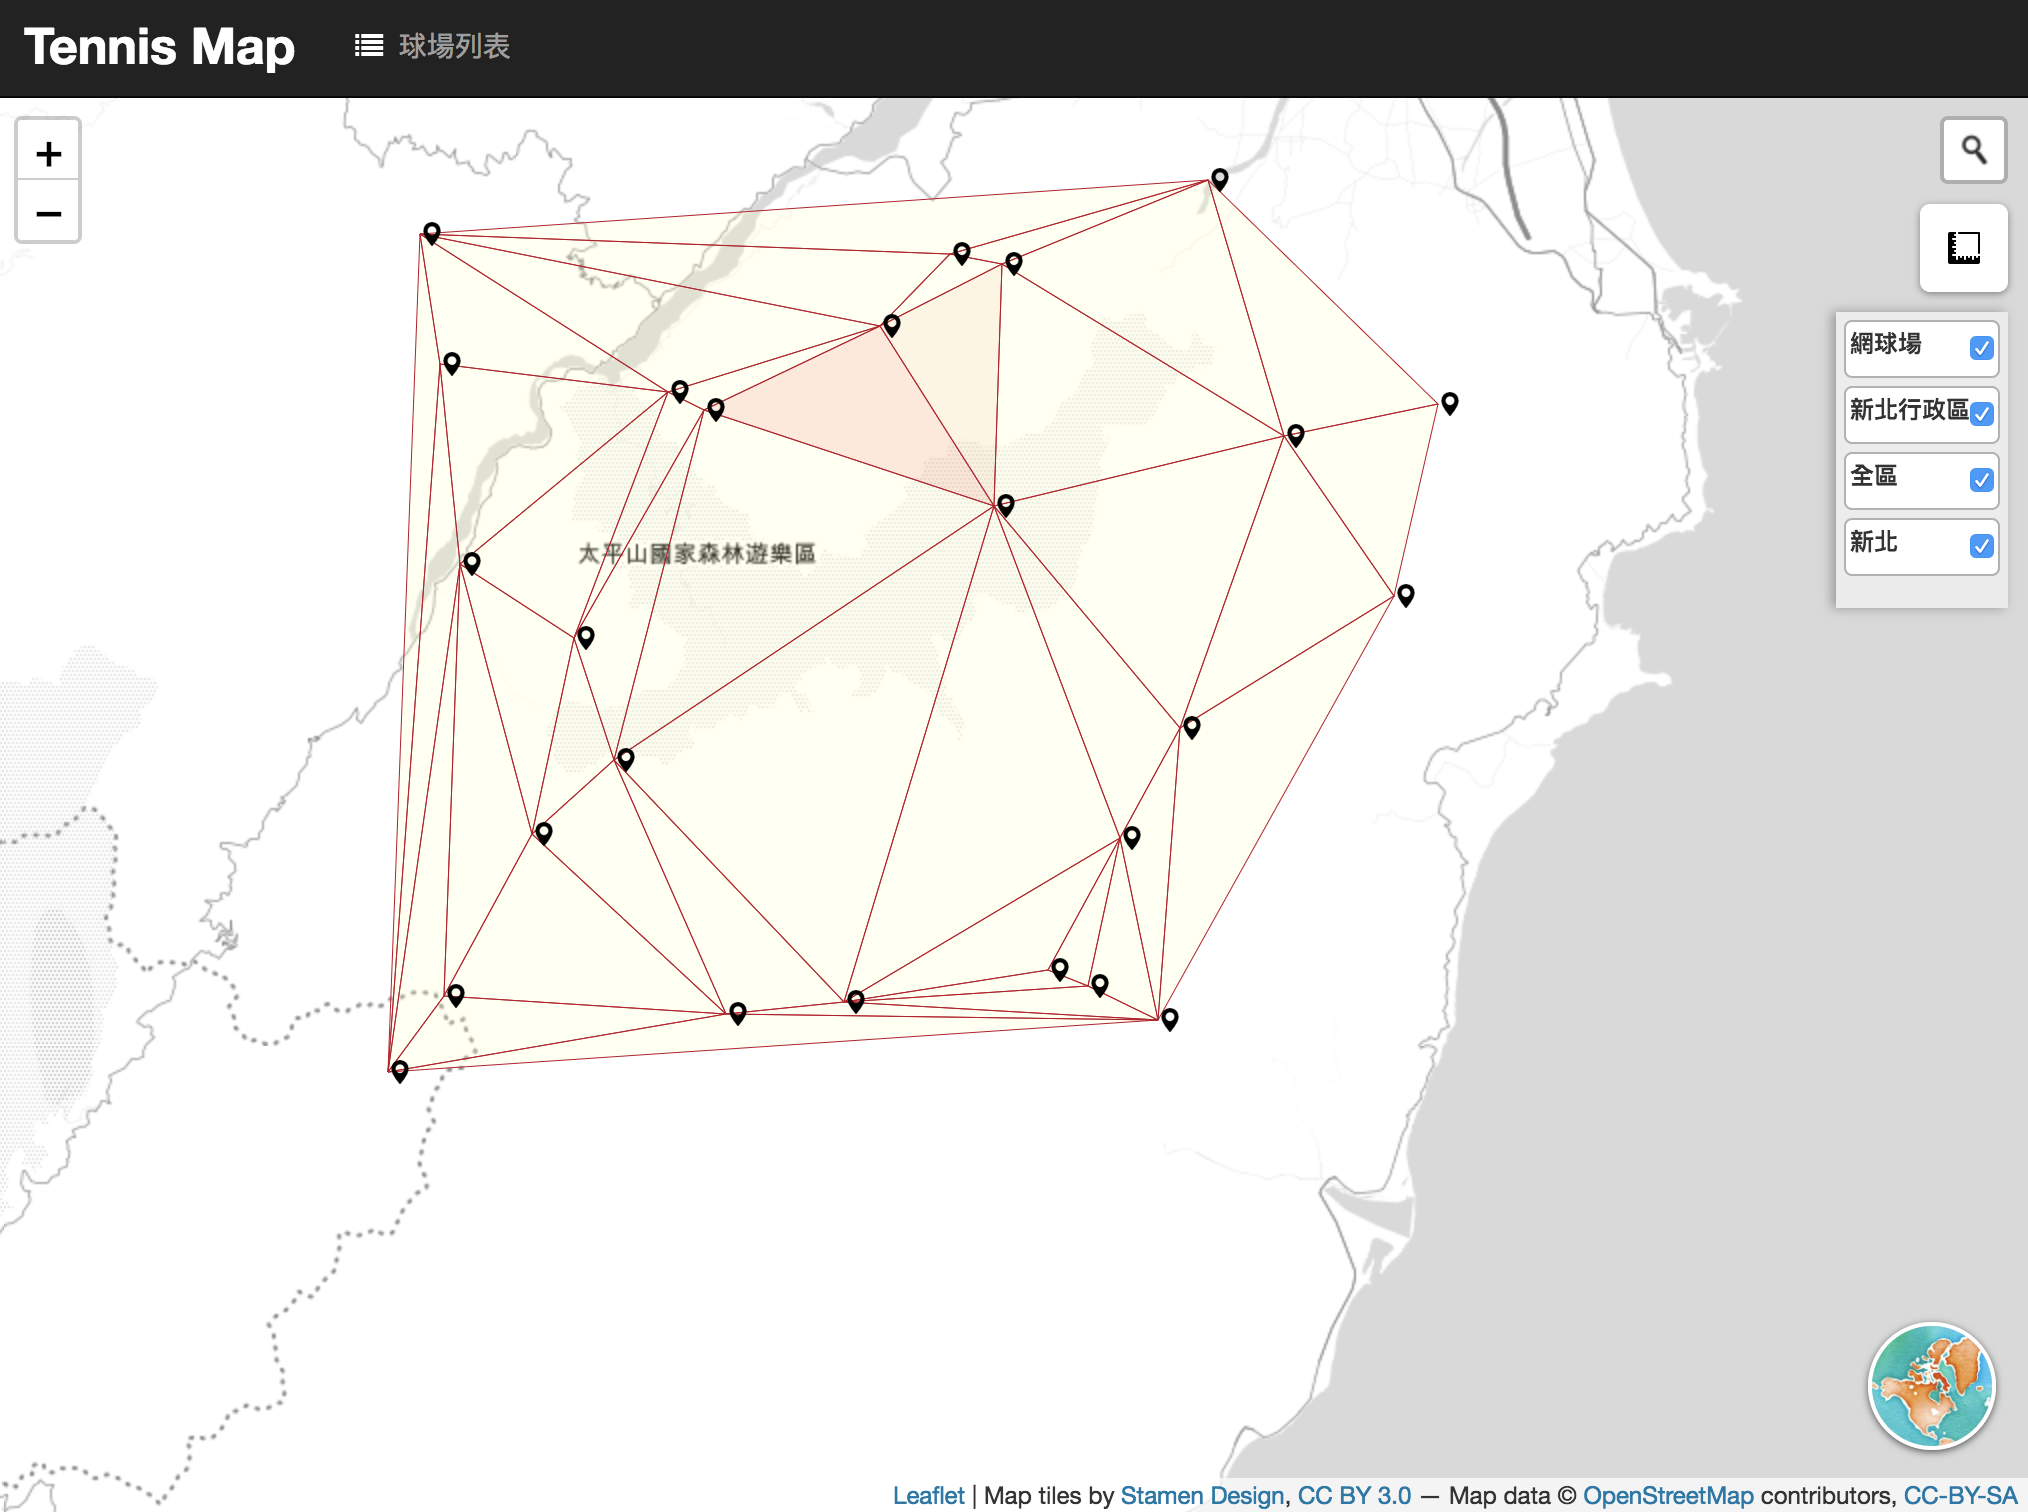
比較一下前面的成果,跟用interpolate把gridType設為triangle
var idw_grid = turf.interpolate(ramdompts_ipl, 2,
{ gridType: 'triangle', property: 'obs', units: 'kilometers' });
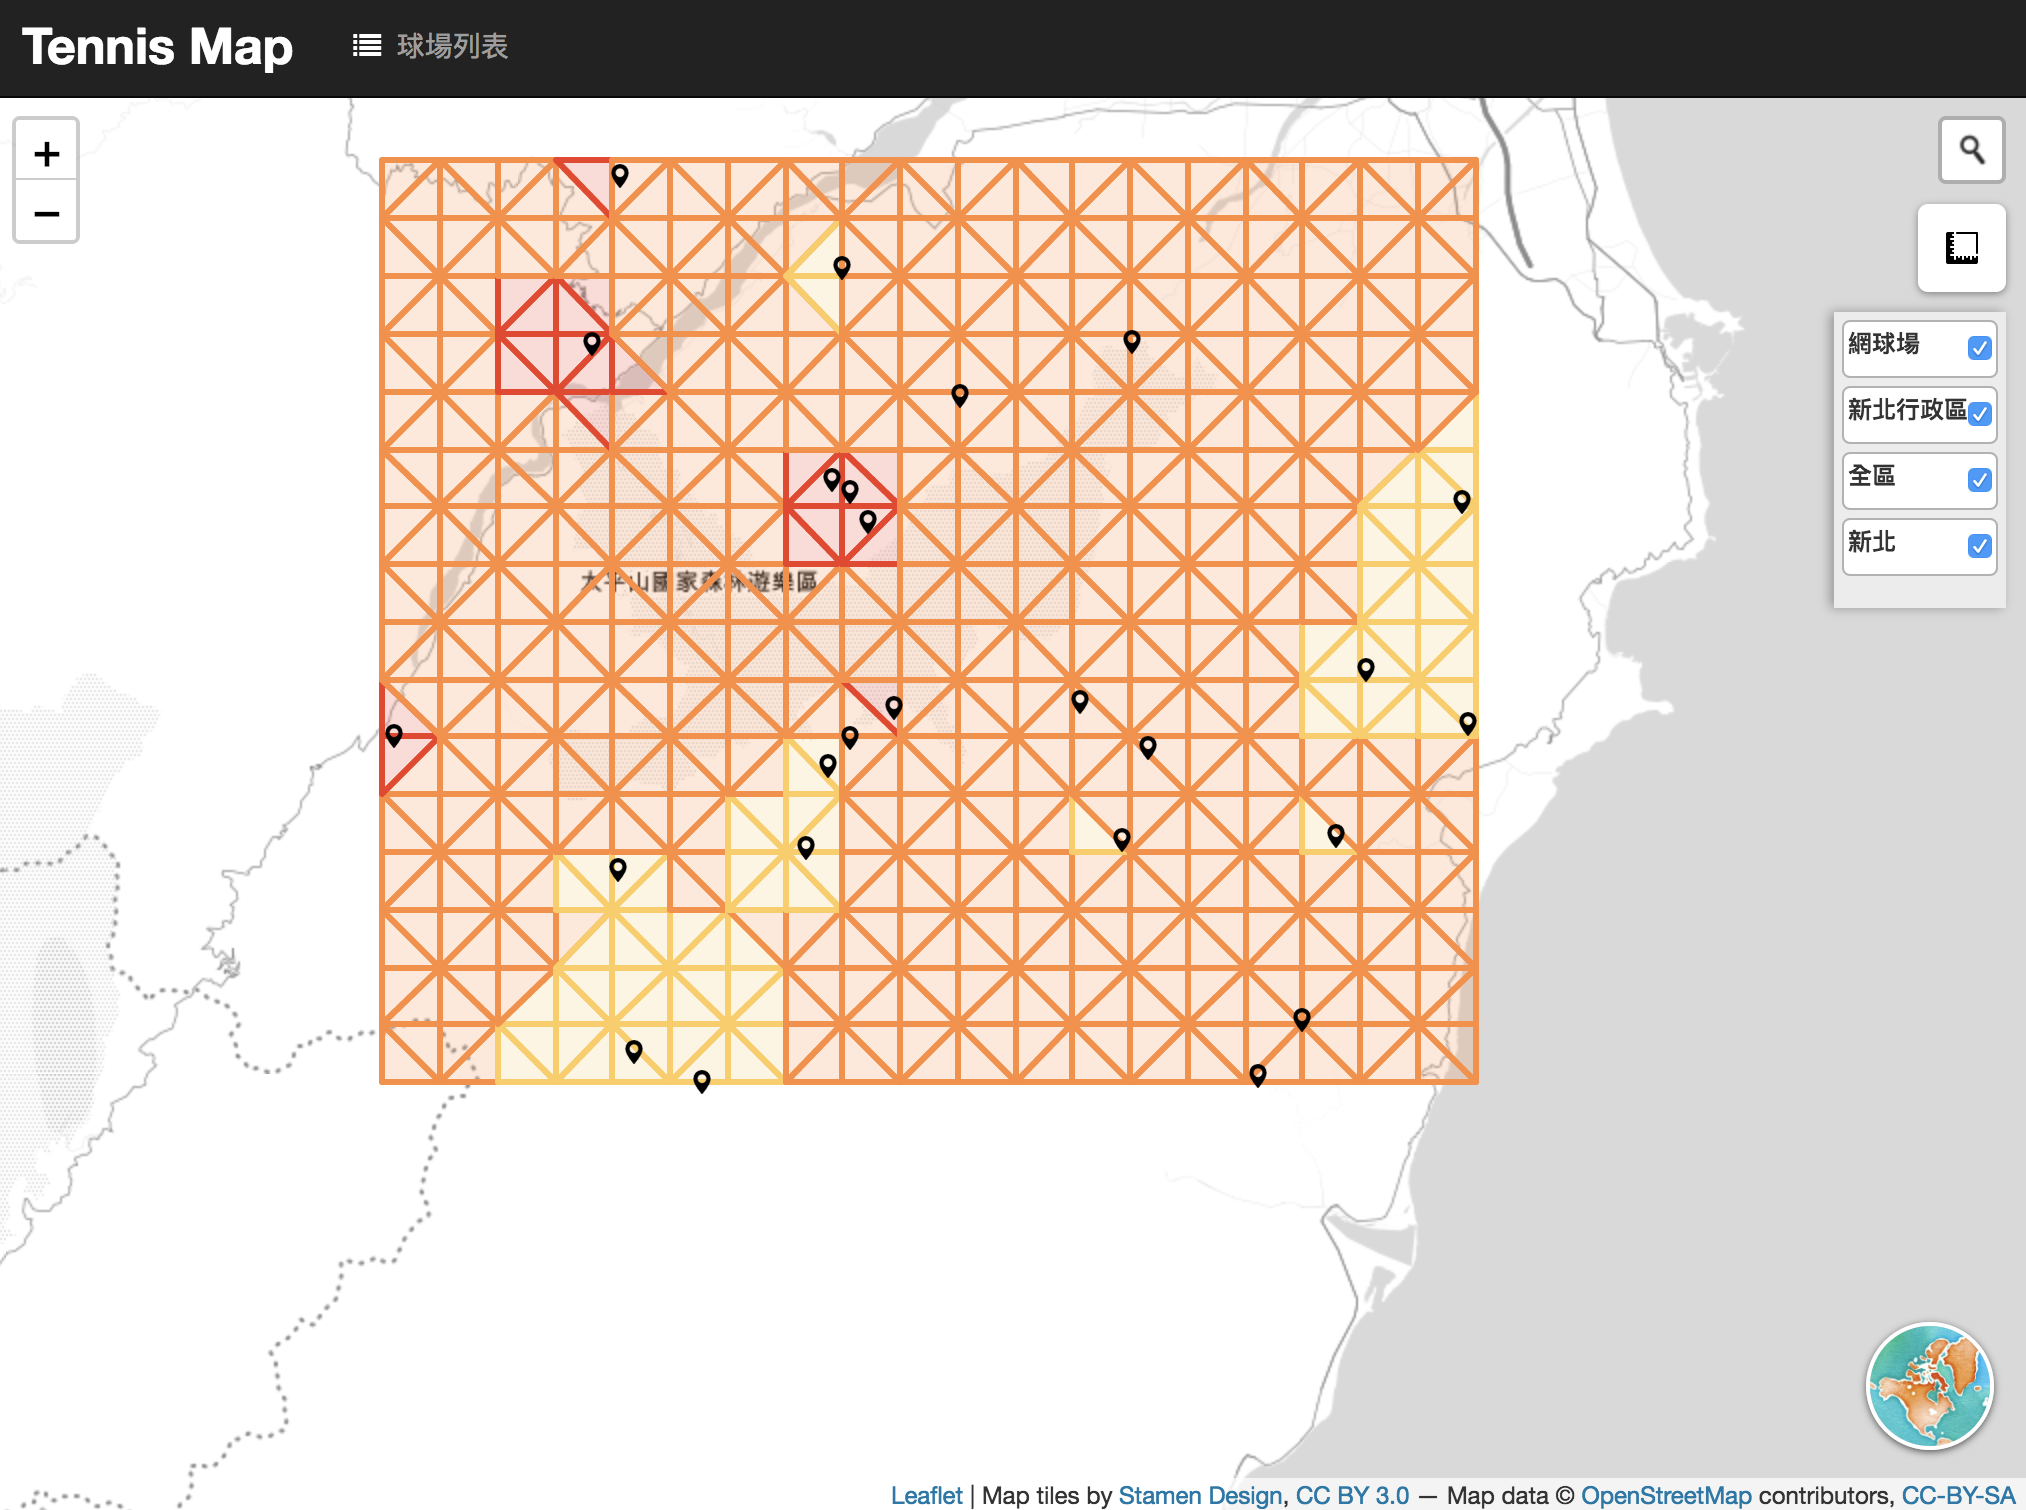
感覺TIN省很多圖形~
前面TIN講到Delaunay,那就一定要再提到Voronoi Diagram,兩者是對偶關係:
Voronoi Diagram:鄰近的點的中垂線,形成 Voronoi Diagram。(演算法筆記)
Voronoi Diagram 能表達的是最近或範圍的概念,在地理學上非常適合哪來將點的資料轉成面資料。
turf.js產生Voronoi Diagram的方法:
var voronoiPolygons = turf.voronoi(ramdompts_ipl,
  { bbox: [121.41, 24.34, 121.8, 24.65] });
在每個Diagram中塞入值:
turf.featureEach(voronoiPolygons, function (feature, index) {
  feature.properties.obs = ramdompts_ipl.features[index].properties.obs;
});
加入圖層:
var voronoiLayer = L.geoJson(voronoiPolygons, {
  onEachFeature: function (feature, layer) {

    layer.bindPopup(feature.properties.obs.toFixed(3).toString());
  },
  style: function (feature) {

    return {
      "fillColor": getColor(feature.properties.obs),
      "weight": 0.5,
      "color": '#bd0026',
      "opacity": 1,
    }
  }
}
).addTo(map);
成果:
Voronoi Diagram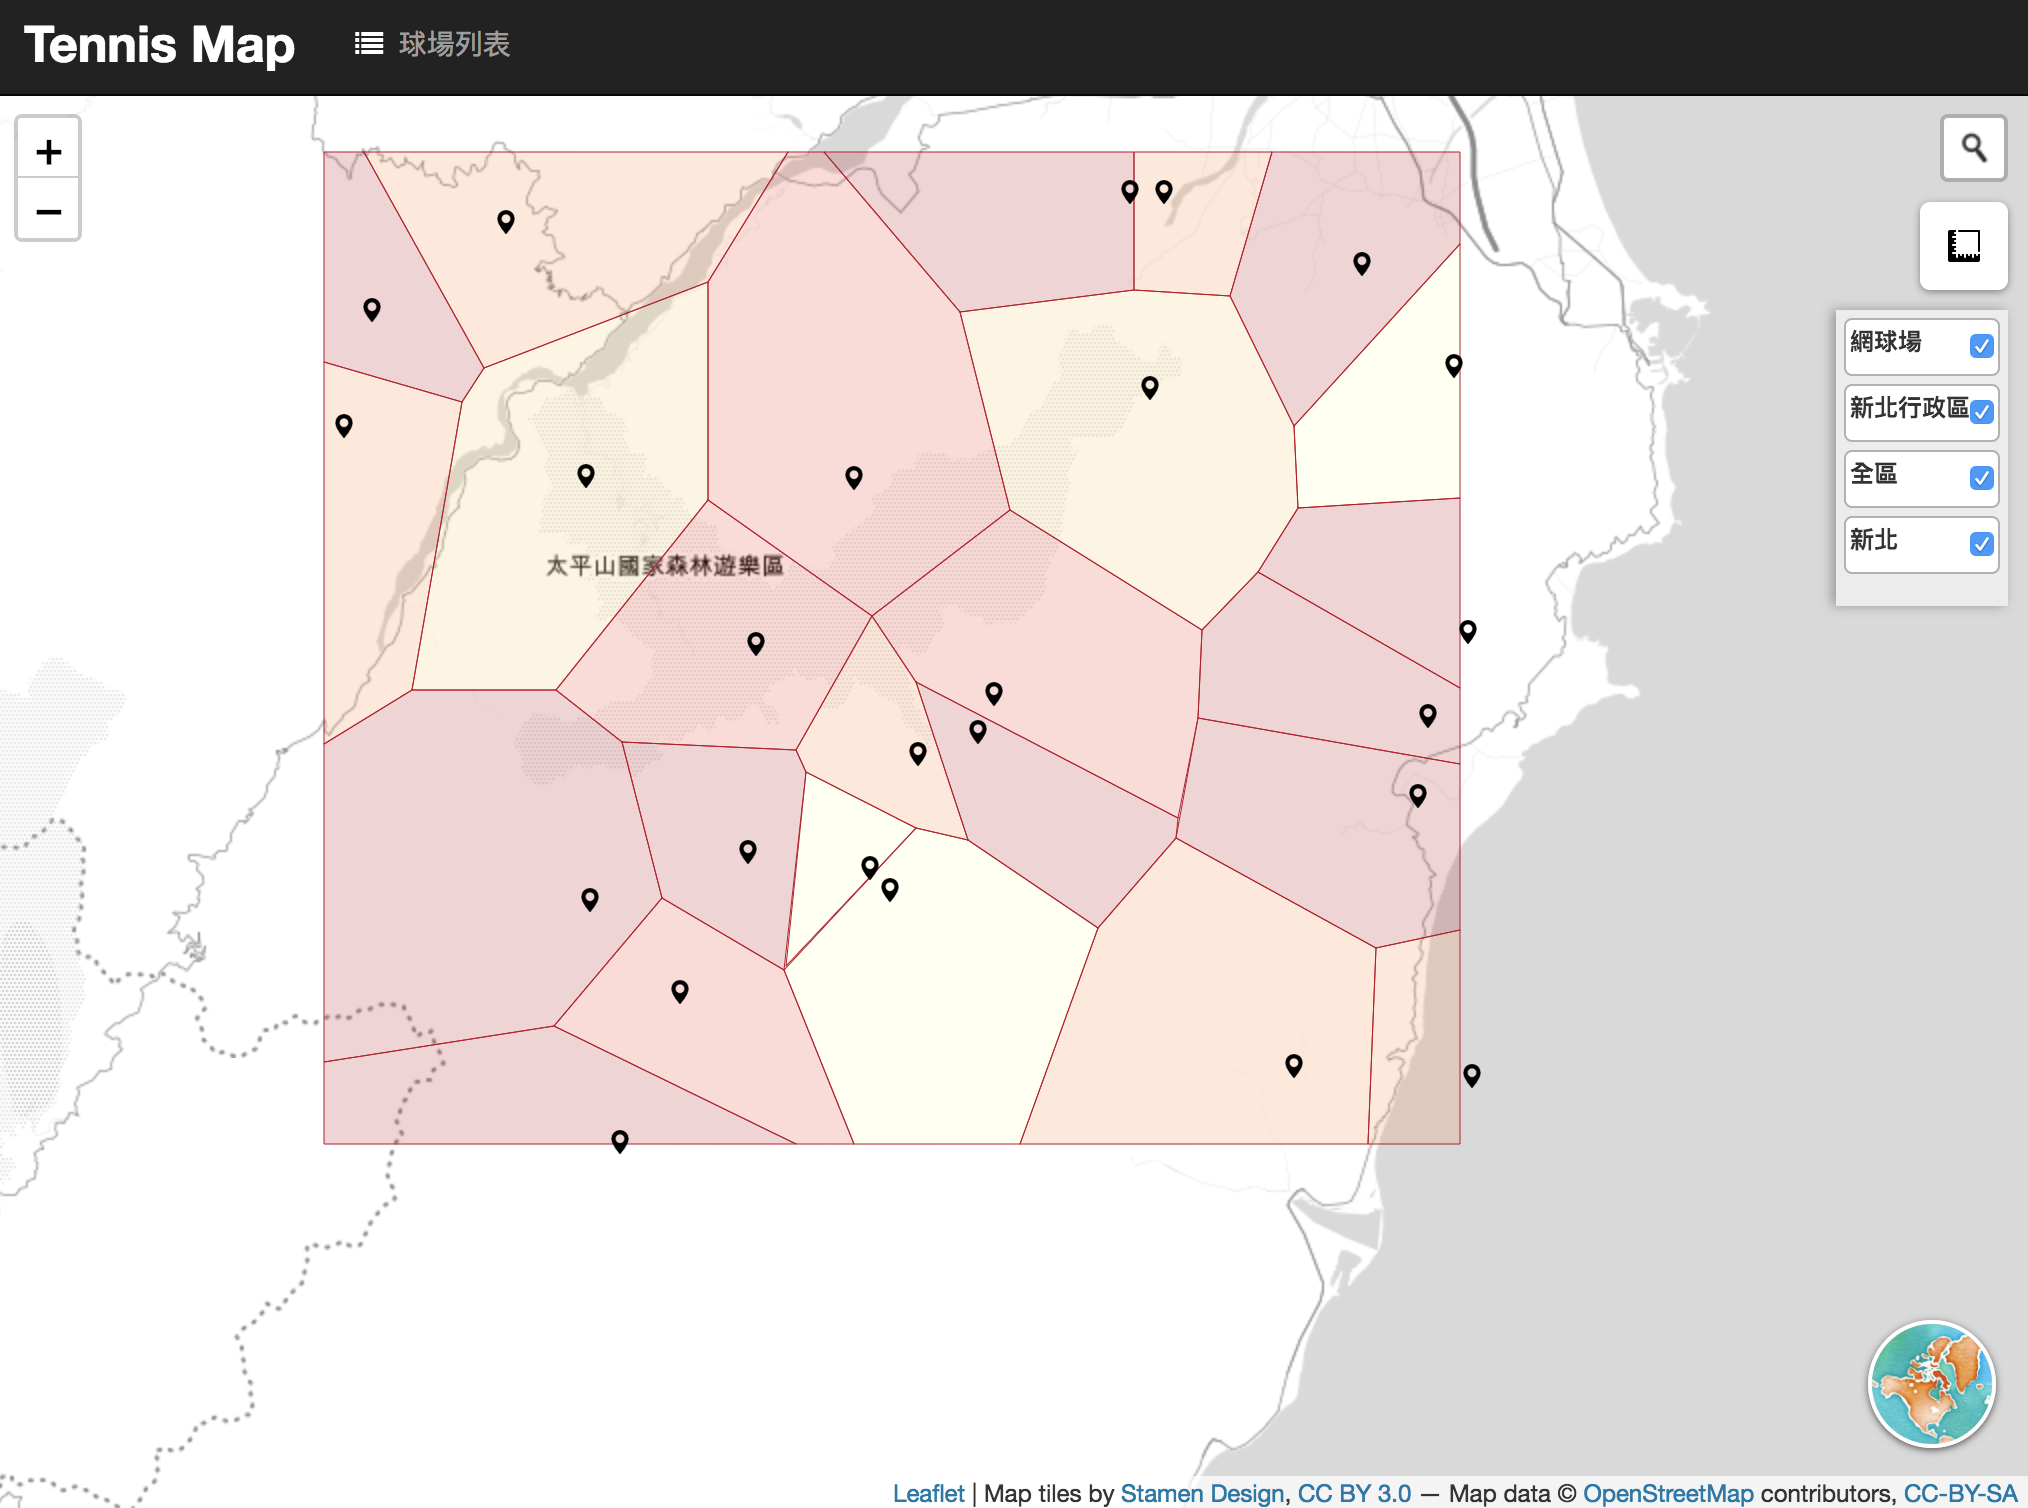
套疊TIN與Voronoi Diagram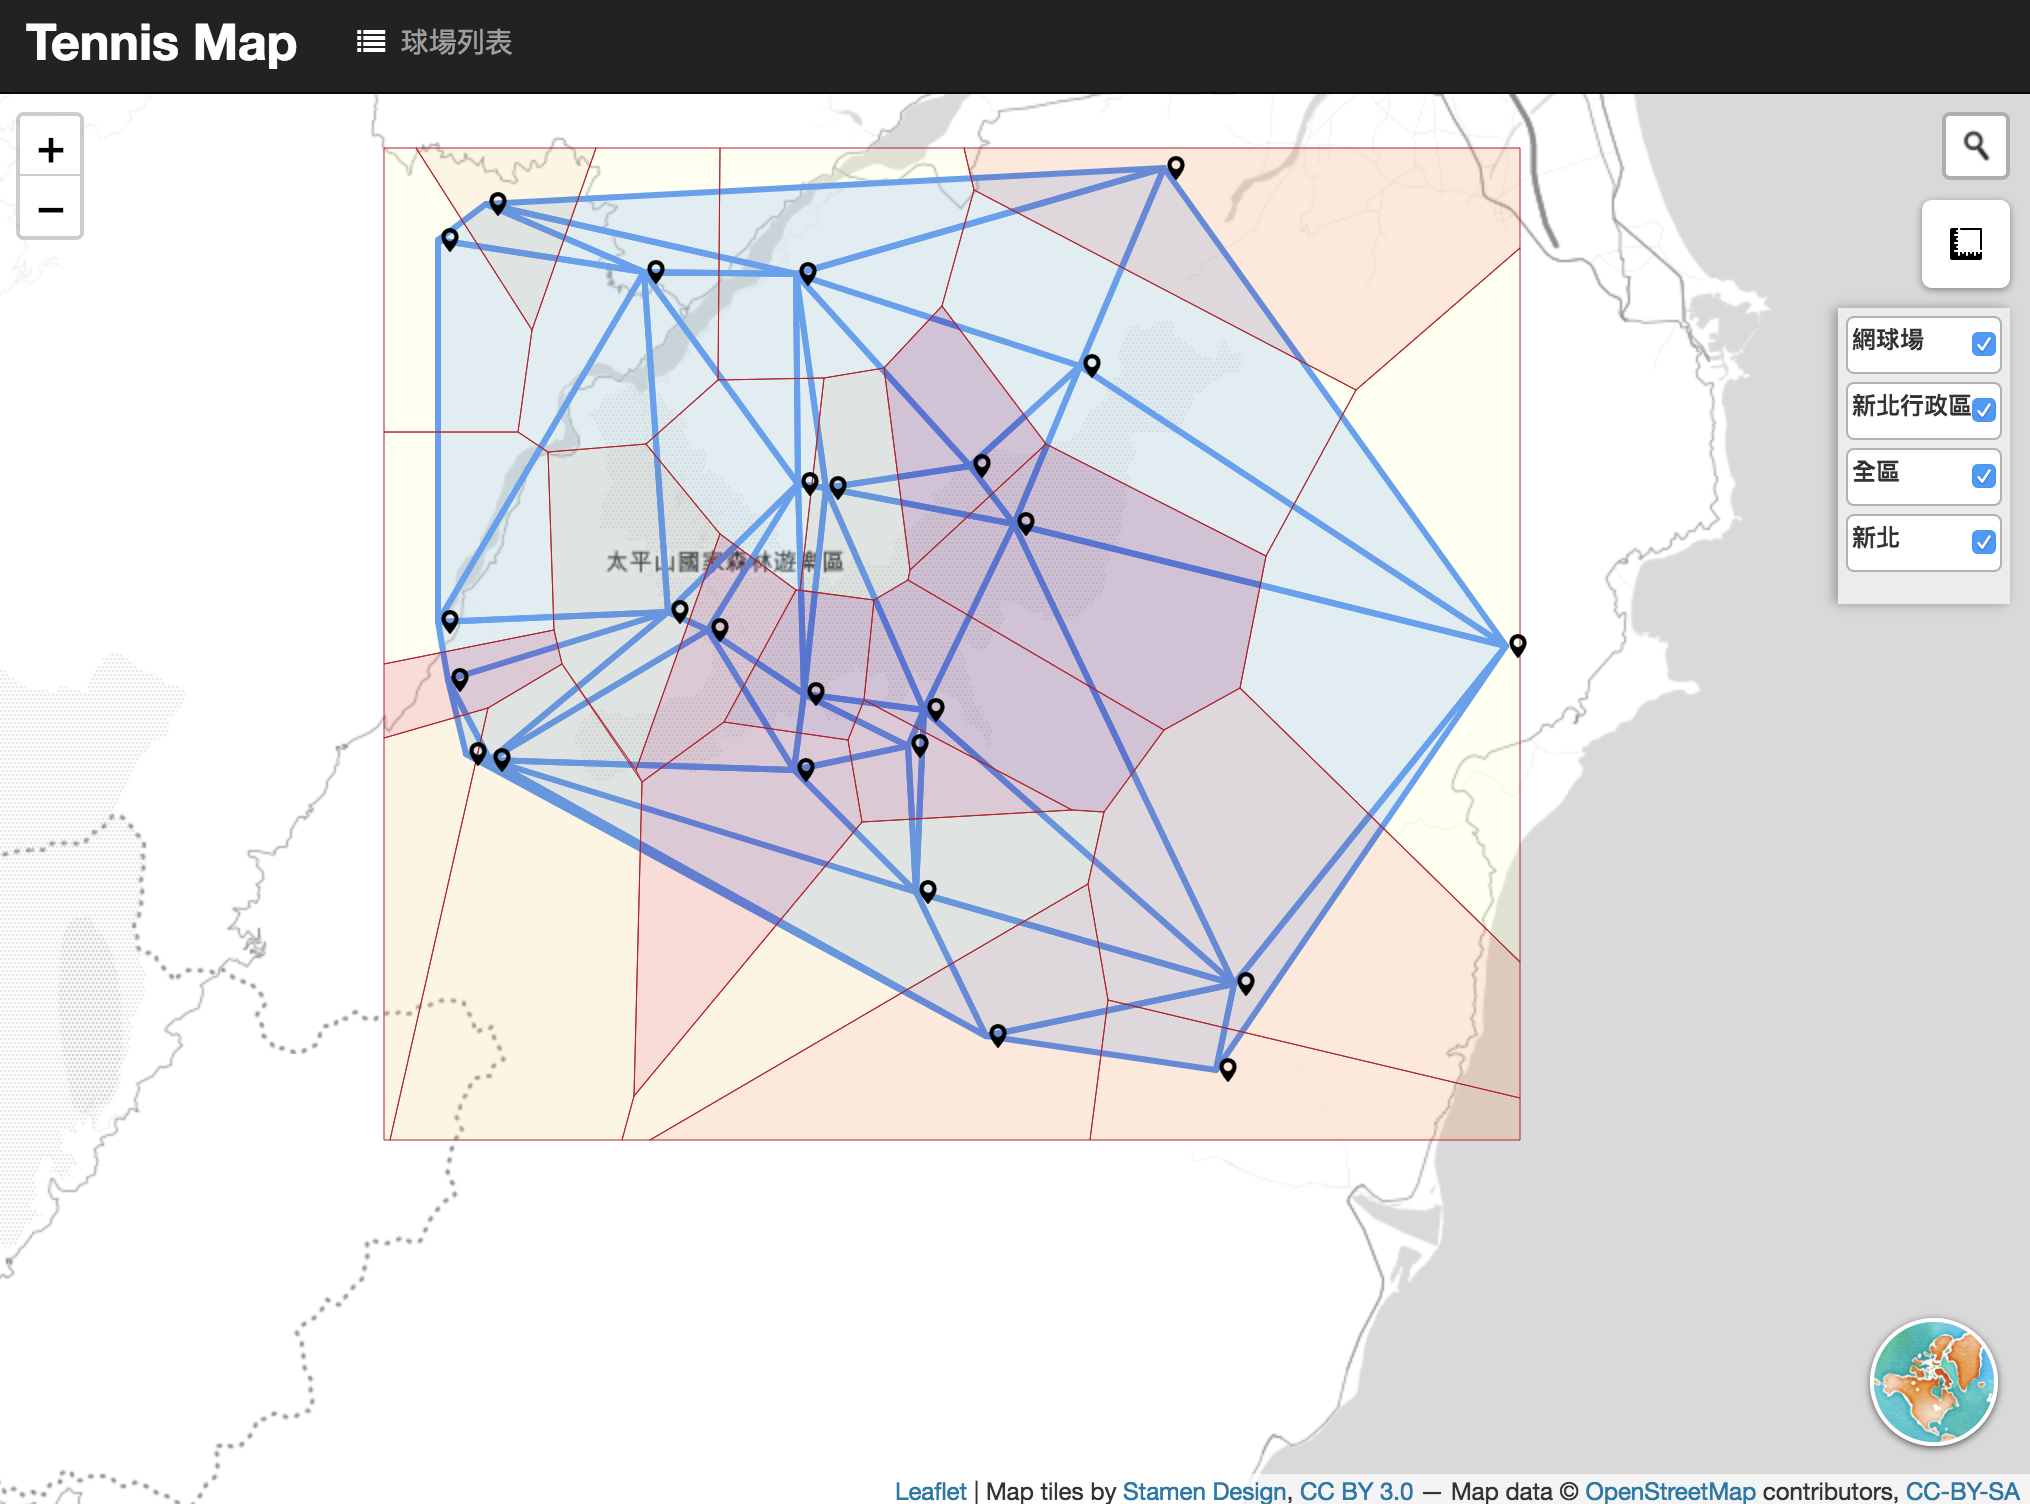
今天介紹了IDW法(規則網格)、TIN(不規則三角網)、Voronoi Diagram,這些方法除了在webGIS會看到,在D3.js等視覺化領域也是很常用到,在turf.js中使用這些方法很簡單,但我自己認為關鍵在於使用時機,要知道每種方法的意義及限制,才不會誤用或誤解算出來的東西,讓資訊傳達更正確。
另外,GIS領域有很多其他更多內插方法,例如Bilinear, Kriging, nearest neighbor等等,這些東西目前turf.js還沒看到,但也可以自己找工具或是動手實作看看喔。
今天的程式碼一樣放在github(day19的commit)。
