因為將ELK分開來放,在這邊列出各自需要調整的設定,:
/etc/elasticsearch/elasticsearch.yml中的network.host設定,視個人需求修改Port,這部分必須與Winlogbeat設定中的setup.kibana一致:network.host: elasticsearch_server_ip
http.port: 9200
/etc/kibana/kibana.yml中的server.host設定,視個人需求修改Port,這部分必須與Winlogbeat設定中的output.elasticsearch一致:server.port: 5601
server.host: 'kibana_server_ip'
C:\Program Files\Winlogbeat\winlogbeat.yml的output.elasticsearch和setup.kibana:output.elasticsearch:
hosts: ["elasticsearch_server_ip:9200"]
setup.kibana:
  host: "kibana_server_ip:5601"
如果設定都正確的話,在Kibana上就可以看到資料,也可以Idexing和視覺化,總之按照下面步驟來試試:
點左側的'Discover',如果設定都正確的情況下,會直接跳出步驟2的圖
設定Idex Pattern,因為所有時間的Winlogbeat我都要使用,這邊就設成Winlogbeat*: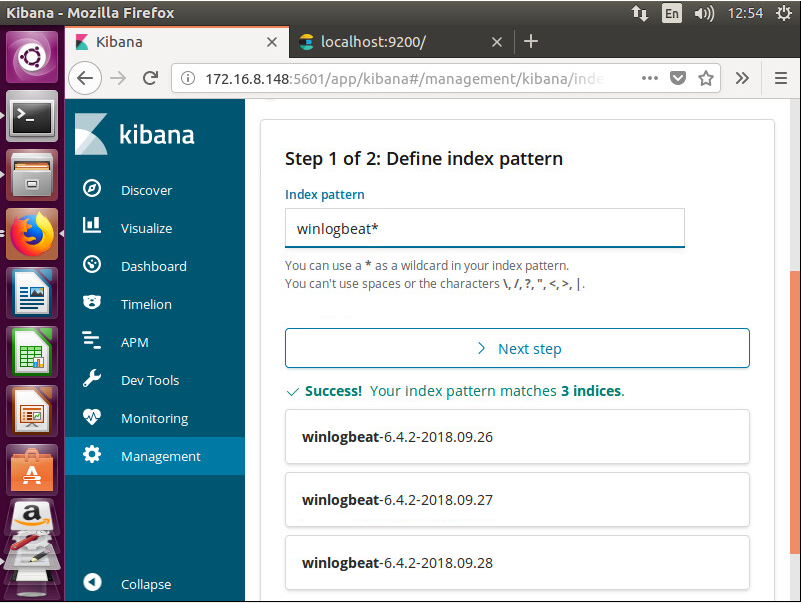
設定用timestamp做filter,用時間來篩選資料: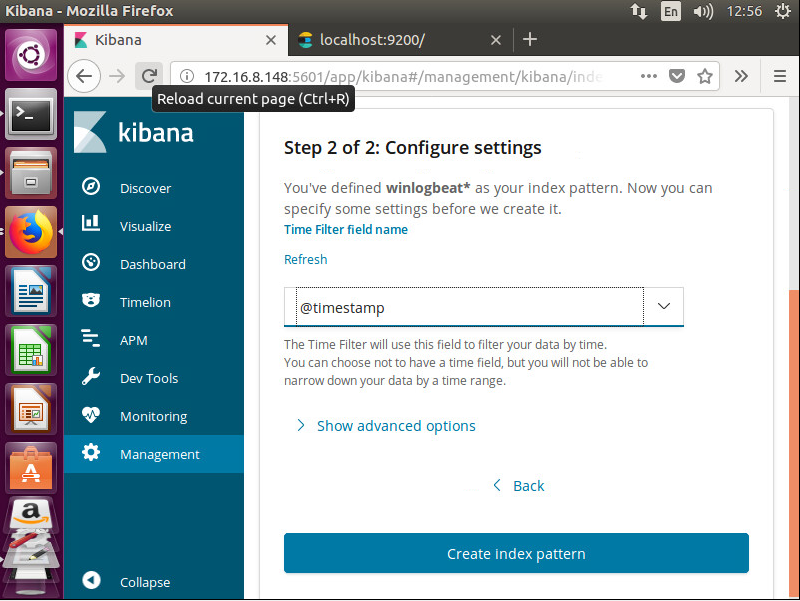
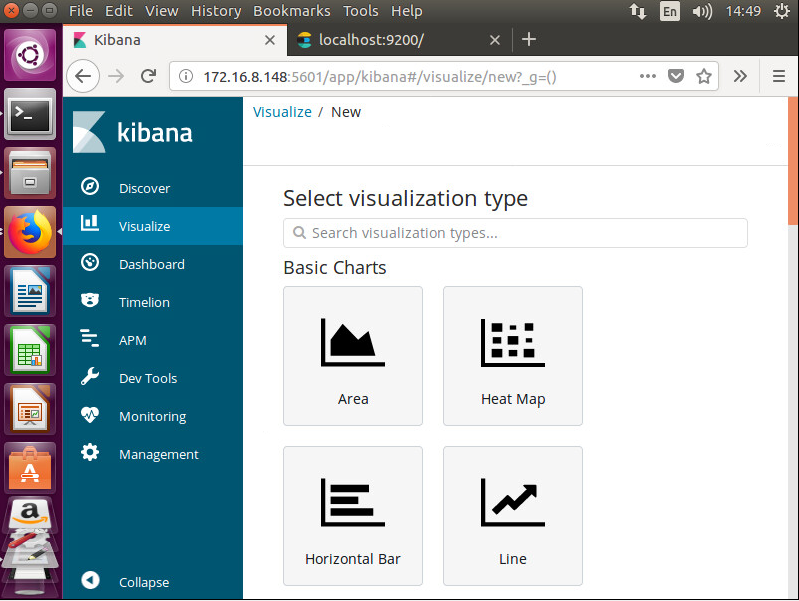
設定視覺化的資料範圍與選擇圖表類型: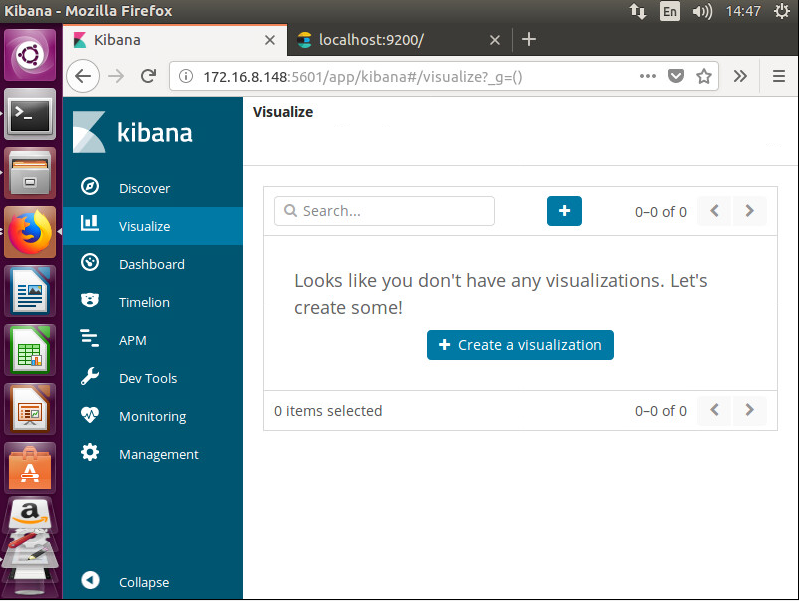

做到這邊也有一些問題被顯出來了,用Winlogbeat送給Elasticsearch的Log是沒有結構化的,像是使用的DLL、Source IP、Session等資料全部都不能被篩選,為了解決這個問題就需要Logstash,總之就是要架Logstash來把資料結構化。(如果是收集Secure、System、Application等Windows內建的Event Log,就不需要架Logstash來結構化)
更正,用Winlogbeat就可以Parsing Logs of Sysmon。