<rect>元素繪製長條圖第一個練習先從簡單化的資料來開始,這邊有一組數值,繪製出直式長條圖即算是完成。
var dataSet = [70, 130, 120, 95, 80, 170, 143]
接著先把待會要使用到的變數宣告出來。
var width = 400 // svg寬度
var height = 400 // svg寬度
var padding = {
  top: 20,
  right: 20,
  bottom: 20,
  left: 20
} // 內距
var graphicHeight = height - padding.top - padding.bottom // 圖表高度為svg高度扣掉內距
var rectStep = 35 // 各別長條圖的距離
var rectWidth = 30 // 長條圖的寬度
var maxValue = 200 // 數值最大值
以上變數包含了我們希望圖表呈現出來的樣子。
其中數值最大值maxValue是已經先假設當資料為200時長條圖會佔滿畫面的100%,這部份的計算會在稍後填上公式。
接著在html把<svg>加入
var svg = d3.select("body")
  .append("svg")
  .attr("width", width)
  .attr("height", height)
接著,按照前面所提到的繪圖步驟來實作:設定選擇集 → 綁定資料 → 綁作元素。
由於畫面上沒有任何元素,暫不考慮更新資料的方法,先使用enter()方式來繪圖。
var rect = svg.selectAll("rect")
  .data(dataSet)
  .enter()
  .append("rect")
  .attr("fill", "steelblue")
  .attr("x", function(d,i){
      return padding.left + i * rectStep
  })
  .attr("y", function(d){
    return height - padding.bottom - graphicHeight * (d / maxValue) // 畫面高度扣掉長條圖高度作為繪製長條圖的起點
  })
  .attr("width", rectWidth)
  .attr("height", function(d){
    return graphicHeight * (d / maxValue) // 使用maxValue最大值作為畫面高度100%計算該筆資料佔畫面的百分比
  })
繪製出來的結果:
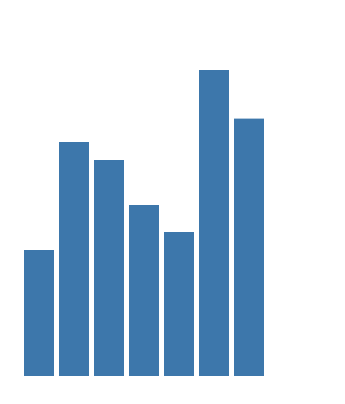
這段程式碼和「Day08 D3 資料綁定的理解(2)」中所帶的範例是一模一樣的,只是改為加入<rect>元素,並增加一些繪圖的屬性而已。
<rect>為svg繪製矩型的元素,這邊使用fill填寫、x和y設定坐標、width和height設定寬高。
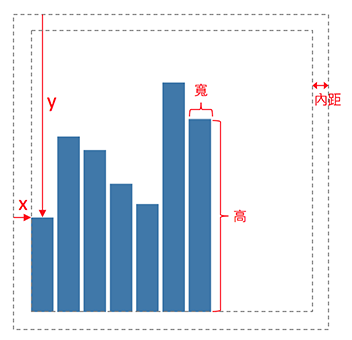
要注意的是,x和y軸的起點是從左上角為起點往右下方延伸的。
為方便檢視我在圖上加上一些說明
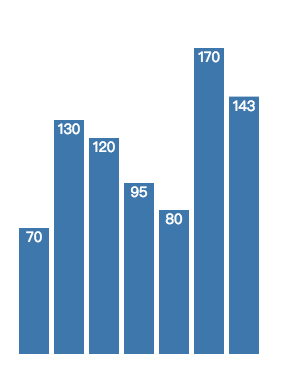
<text>加上長條圖的數字接著來為長條圖加上資料的數字,繪製的屬性與前面使用<rect>的計算雷同,只是改使用svg的文件元素<text>
var text = svg.selectAll("text")
  .data(dataSet)
  .enter()
  .append("text")
  .attr("fill","white")
  .attr("font-size","14px")
  .attr("text-anchor","middle")
  .attr("x", function(d,i){
      return padding.left + i * rectStep
  })
  .attr("y", function(d){
      //return height - padding.bottom - d
    return height - padding.bottom - graphicHeight * (d / maxValue)
  })
  .attr("dx", rectWidth/2)
  .attr("dy", "1em")
  .text(function(d){
      return d
  })
輸出的畫面為


 iThome鐵人賽