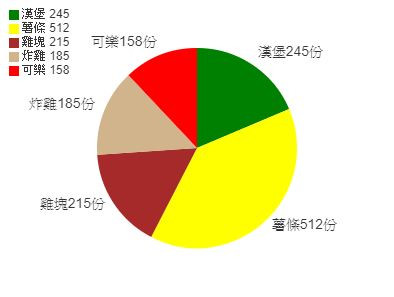
基本畫布建立
<canvas id="cvs" width="400" height="300"></canvas>
var cvs = document.getElementById('cvs');
var ctx = cvs.getContext('2d');
建立圖表資料、位置樣式的設定
var infoData = [
        {name:'漢堡', value: 245},
        {name:'薯條', value: 512},
        {name:'雞塊', value: 215},
        {name:'炸雞', value: 185},
        {name:'可樂', value: 158}
];
var x = 200,
    y = 150,
    r = 100,
    begin_deg = -90 * Math.PI/180,
    color = ['green', 'yellow', 'brown', 'tan', 'red', 'green', 'blue', 'pink'],
    total = 0;
infoData 裡的物件 value 值可以是全部加起來總和等於 1 或是 100
在畫角度時就可以直接計數
當 value 的值不是百分比而是其他整數
數量全部的總和不是 1 或 100 時
就要先計算總和之後會用到
for (var i = 0; i < infoData.length; i++) {
  total += parseInt(infoData[i].value);
}
這會取出全部物件裡的 value 計算總和
開始畫圓餅圖
for (var i = 0; i < infoData.length; i++) {
    var value_deg = infoData[i].value / total * 360 * Math.PI/180;
    // 取得 value 的角度
    var end_deg = begin_deg + value_deg;
    // value結束角度 = value起始角度 + value角度

    // 畫出每個物件的範圍、填色
    ctx.beginPath();
    ctx.moveTo(x, y);
    ctx.arc(x, y, r, begin_deg, end_deg);
    ctx.fillStyle = color[i];
    ctx.fill();

    // 取得物件角度中間值並列出每個物件的名字、數量
    var text_deg = begin_deg + value_deg * 0.5;
    var text_X = x + (r + 10) * Math.cos(text_deg);
    var text_Y = y + (r + 10) * Math.sin(text_deg);

    // 為了讓文字在圓外就必需設定在圖 左(右) 邊時文字要靠 右(左)
    if((text_deg > 90 *Math.PI/180) && (text_deg < 270 *Math.PI/180) ) {
        ctx.textAlign = 'end';
    }

    // 填入文字
    ctx.font = '14px Arial';
    ctx.fillStyle = "#333";
    var text = infoData[i].name + infoData[i].value + '份';

    ctx.fillText(text, text_X, text_Y);
    begin_deg = end_deg;
}
上方是圓餅圖表的部份
另外左上資料列表的作法就比較簡單
只需要 畫矩形 + 放文字 就結束 :D
for (var i = 0; i < infoData.length; i++) {
    ctx.beginPath();
    ctx.fillStyle = color[i];
    ctx.fillRect(12, 12 + 14*i, 10, 10);

    ctx.font = '12px Arial';
    ctx.fillStyle = '#333';
    ctx.textAlign = 'start';
    ctx.fillText(infoData[i].name + ' '+infoData[i].value, 25, 20 + 14*i);
}
