昨天介紹完支持向量機SVM,今天要來介紹決策樹Decision Trees,決策樹簡單來說就是把資料集以一棵樹呈現。一顆決策樹包含節點、分支、葉子,並根據條件將子葉分支,參考下圖: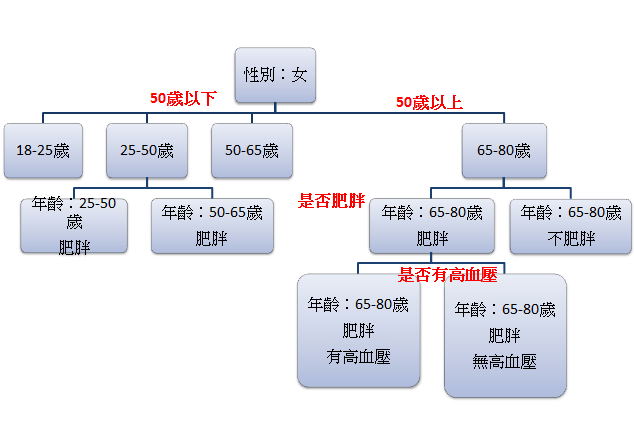
而隨機森林Random forest是建立在決策樹上的學習集合,在下一節將會詳細說明。
%matplotlib inline
import numpy as np
import matplotlib.pyplot as plt
import seaborn as sns; sns.set()
from sklearn.datasets import make_blobs
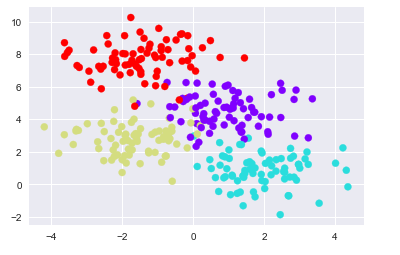
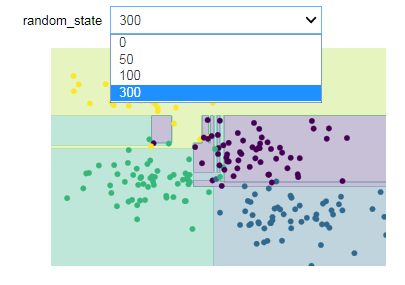
X, y = make_blobs(n_samples=300, centers=4,
random_state=0, cluster_std=1.0)
plt.scatter(X[:, 0], X[:, 1], c=y, s=50, cmap='rainbow');
建立在該數據上的簡單決策樹將根據一些定量標準沿著兩軸迭代來分割數據,並且在每個級別根據其中的多數點來分配新區域的標籤。
可以使用DecisionTreeClassifier估算器在Scikit-Learn中完成將決策樹擬合到我們的數據的過程:
from sklearn.tree import DecisionTreeClassifier
tree = DecisionTreeClassifier().fit(X, y)
def visualize_classifier(model, X, y, ax=None, cmap='rainbow'):
    ax = ax or plt.gca()

    # Plot the training points
    ax.scatter(X[:, 0], X[:, 1], c=y, s=30, cmap=cmap,
               clim=(y.min(), y.max()), zorder=3)
    ax.axis('tight')
    ax.axis('off')
    xlim = ax.get_xlim()
    ylim = ax.get_ylim()

    # fit the estimator
    model.fit(X, y)
    xx, yy = np.meshgrid(np.linspace(*xlim, num=200),
                         np.linspace(*ylim, num=200))
    Z = model.predict(np.c_[xx.ravel(), yy.ravel()]).reshape(xx.shape)

    # Create a color plot with the results
    n_classes = len(np.unique(y))
    contours = ax.contourf(xx, yy, Z, alpha=0.3,
                           levels=np.arange(n_classes + 1) - 0.5,
                           cmap=cmap, clim=(y.min(), y.max()),
                           zorder=1)

    ax.set(xlim=xlim, ylim=ylim)

visualize_classifier(DecisionTreeClassifier(), X, y)
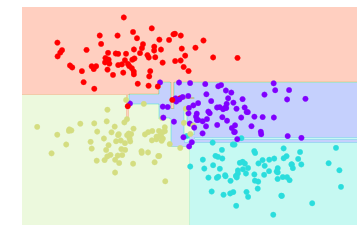
如上圖,我們可以看到不屬於該類別的資料,也會被分類於該類別,造成over-fitting的情形,代表兩個子樹生成一樣的結果。
可惡今天打到一半沒有存草稿QQ
最近好友詢問:
若是想要呈現文章第一張圖,資料樹狀圖,可以使用export_graphviz()函式,相關內容可以參考官方文件:https://scikit-learn.org/stable/modules/generated/sklearn.tree.export_graphviz.html