今天要來講解隨機森林Random Forests,接續上一節所講解的決策樹Decision Trees,並且有提到說Random forest是建立在決策樹上的學習集合。在前一節有提到,決策樹經常會遇到擬合的問題,而在隨機森林演算法中,因為forest是由多個Trees所組成,所以對隨機森林反而希望計算速度快速為要點,不會追求單顆tree擬和的情形。所以,會以Ensembles of Estimators- Random Forests講解為何不需要太在意Trees的擬合狀況。
from sklearn.tree import DecisionTreeClassifier
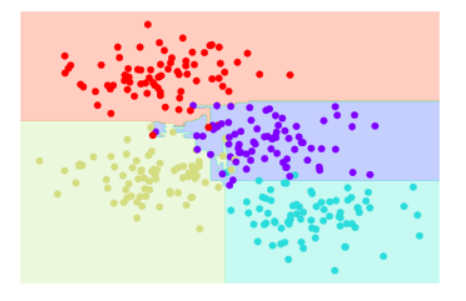
from sklearn.ensemble import BaggingClassifier
tree = DecisionTreeClassifier()
#通過每個估計器擬合80%的訓練點
bag = BaggingClassifier(tree, n_estimators=100, max_samples=0.8,
random_state=1)
bag.fit(X, y)
visualize_classifier(bag, X, y)
隨機森林主要應用模組:RandomForestClassifier
from sklearn.ensemble import RandomForestClassifier

model = RandomForestClassifier(n_estimators=100, random_state=0)
visualize_classifier(model, X, y);
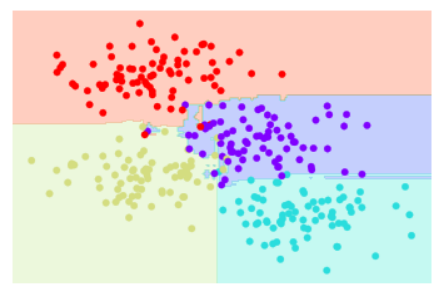
可以在上圖看到,他對資料的分割更加正確。
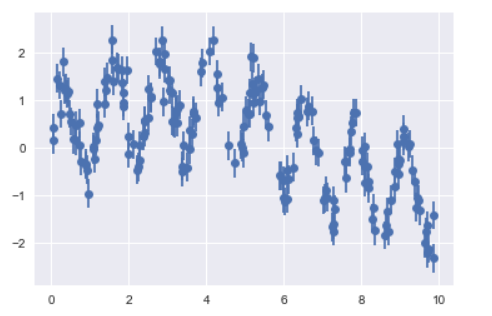
將隨機森林結合之前講解的線性回歸,將資料回歸至一條線上,並進行預測。使用sin()正弦函數,可以看到輸出結果的圖形,符合正弦函數的圖型。
rng = np.random.RandomState(42)
x = 10 * rng.rand(200)

def model(x, sigma=0.3):
    fast_oscillation = np.sin(5 * x)
    slow_oscillation = np.sin(0.5 * x)
    noise = sigma * rng.randn(len(x))

    return slow_oscillation + fast_oscillation + noise

y = model(x)
plt.errorbar(x, y, 0.3, fmt='o');
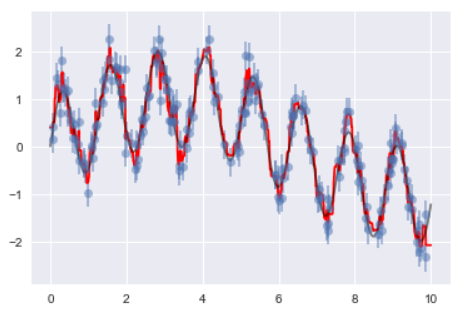
from sklearn.ensemble import RandomForestRegressor
forest = RandomForestRegressor(200)
forest.fit(x[:, None], y)

xfit = np.linspace(0, 10, 1000)
yfit = forest.predict(xfit[:, None])
ytrue = model(xfit, sigma=0)

plt.errorbar(x, y, 0.3, fmt='o', alpha=0.5)
plt.plot(xfit, yfit, '-r');
plt.plot(xfit, ytrue, '-k', alpha=0.5);
from sklearn.datasets import load_digits
digits = load_digits()
digits.keys(

可以看到上圖,資料keys包含'data', 'target', 'target_names', 'images', 'DESCR'
# set up the figure
fig = plt.figure(figsize=(6, 6))  # figure size in inches
fig.subplots_adjust(left=0, right=1, bottom=0, top=1, hspace=0.05, wspace=0.05)

# plot the digits: each image is 8x8 pixels
for i in range(64):
    tx = fig.add_subplot(8, 8, i + 1, xticks=[], yticks=[])
    tx.imshow(digits.images[i], cmap=plt.cm.binary, interpolation='nearest')

    # label the image with the target value
    tx.text(0, 7, str(digits.target[i]))
from sklearn.cross_validation import train_test_split
from sklearn import metrics

Xtrain, Xtest, ytrain, ytest = train_test_split(digits.data, digits.target,
                                                random_state=0)
model = RandomForestClassifier(n_estimators=1000)
model.fit(Xtrain, ytrain)
ypred = model.predict(Xtest)

print(metrics.classification_report(ypred, ytest))
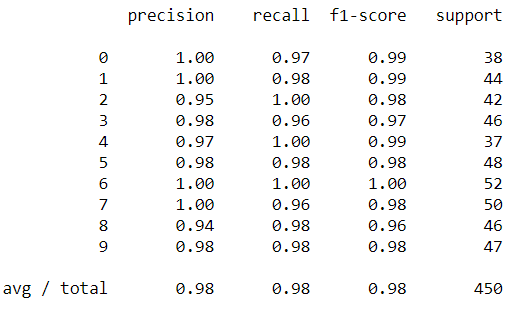
可以看到上圖,最左邊為數字0~9的類別,主要回傳精確值以及support,看這些數字很難懂,先看下圖
from sklearn.metrics import confusion_matrix
mat = confusion_matrix(ytest, ypred)
sns.heatmap(mat.T, square=True, annot=True, fmt='d', cbar=False)
plt.xlabel('true label')
plt.ylabel('predicted label');
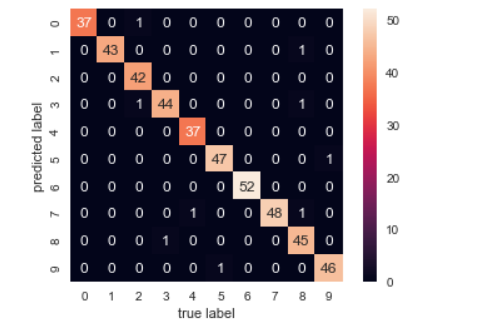
可以看到上圖,X軸為真實手寫數字的值,Y軸會預測手寫的數字的值,其斜對角0對0、1對1、2對2...,代表預測的準確次數(對照前一輸出結果的support),將該類別準確次數/全部筆數=精確值(對照前一輸出結果的precision)