Folium的vector layers 包含
在這邊先說 path_options。在leaflet中稱為 Path,可參考08. Leaflet_Vector Layers(下)的文章。path_option負則處理向量圖層的樣式,可以透過 folium.vector_layers.path_options()去設定樣式,並提供給向量圖層使用,同時也可以在建立向量圖層的時候,引用path_options裡面的參數去設定該圖層的專屬樣式。
以下就針對每一個項目,參考07. Leaflet_Vector Layers(上)的內容進行說明:
在Leaflet中介紹polyline時,用的是以下的程式碼建立高雄大學路的線條:
L.polyline([
    [22.73264868398435, 120.28450012207031],
    [22.72837380478485, 120.28450012207031],
    [22.723307108275556, 120.28604507446288]
]).addTo(myMap)
總共三個點。
現在試著用同樣的三個點繪製polyline,首先先看一下PolyLine的說明:
folium.vector_layers.PolyLine(
    locations,
    popup=None,
    tooltip=None,
    **kwargs
)
在folium.vector_layers.PolyLine()可以設定locations, popup, tooltip, smooth_factor及 no_clip這五個項目,前面三個在上方程式碼可以看到,若想要更了解每個參數的意義及使用方法,可以在jupyter notebook中找到:
Parameters
----------
locations: list of points (latitude, longitude)
    Latitude and Longitude of line (Northing, Easting)
popup: str or folium.Popup, default None
    Input text or visualization for object displayed when clicking.
tooltip: str or folium.Tooltip, default None
    Display a text when hovering over the object.
smooth_factor: float, default 1.0
    How much to simplify the polyline on each zoom level.
    More means better performance and smoother look,
    and less means more accurate representation.
no_clip: Bool, default False
    Disable polyline clipping.
其中smooth_factor及no_clip也可以在Leaflet_PolyLine的option中找到。
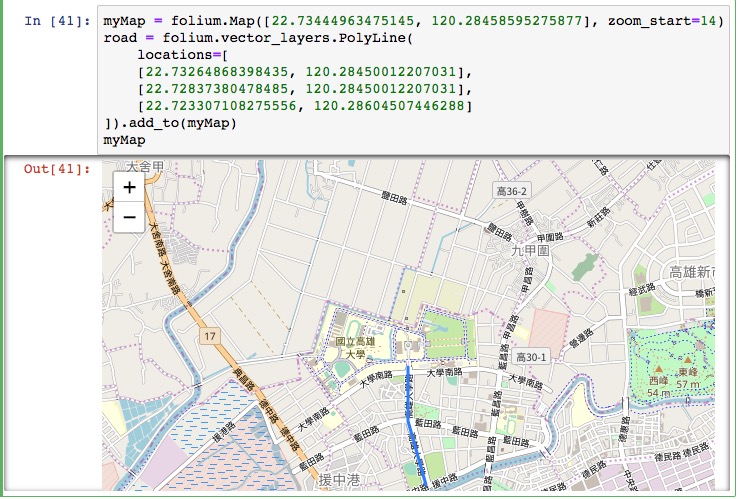
了解folium.vector_layers.PolyLine()的使用方式後,在jupyter notebook中建立一個吧!
myMap = folium.Map([22.73444963475145, 120.28458595275877], zoom_start=14)
road = folium.vector_layers.PolyLine(
    locations=[
    [22.73264868398435, 120.28450012207031],
    [22.72837380478485, 120.28450012207031],
    [22.723307108275556, 120.28604507446288]
]).add_to(myMap)
myMap
第一行建立地圖(myMap),第二行開始建立polyline圖層(road)並加到myMap,最後一行是為了在jupyter notebook中顯示結果才寫的。在輸入完程式碼後,按下shift+enter,就可以在程式碼區塊下方看到目前執行的成果:
在folium中,folium.vector_layers.PolyLine()也可以簡化為folium.PolyLine()使用,後面介紹的其他物件也是如此,若有例外,會再另外說明。
接下來就不另外介紹了,直接比較程式碼吧!
L.polygon([
    [
        [22.72979877936457, 120.27806282043456],
        [22.732134122265894, 120.28162479400635],
        [22.73252993914425, 120.29046535491942],
        [22.73684426881351, 120.29025077819824],
        [22.737715034437908, 120.28591632843016],
        [22.735617271475324, 120.28505802154541],
        [22.73767545430257, 120.2777624130249],
        [22.733717382905326, 120.27643203735352],
        [22.733638220308723, 120.27523040771484],
        [22.72979877936457, 120.27806282043456]
    ],
    [
        [22.731461230943435, 120.27870655059813],
        [22.732292449154702, 120.28007984161376],
        [22.733163243766654, 120.27900695800781],
        [22.73264868398435, 120.27767658233643],
        [22.731461230943435, 120.27870655059813]
    ]
]).addTo(myMap)
上述程式碼在leaflet中建立了一個挖空棒球場的高雄大學校地範圍,接下來看看folium的寫法吧!
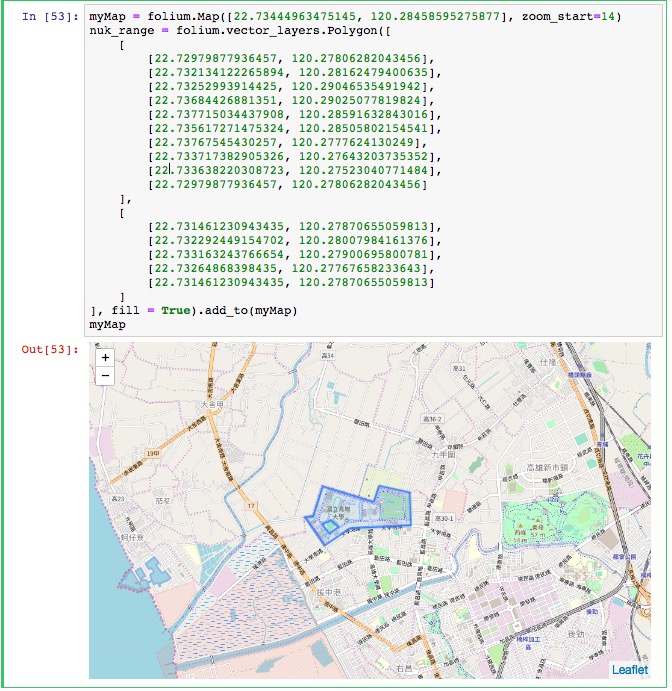
myMap = folium.Map([22.73444963475145, 120.28458595275877], zoom_start=14)
nuk_range = folium.vector_layers.Polygon([
    [
        [22.72979877936457, 120.27806282043456],
        [22.732134122265894, 120.28162479400635],
        [22.73252993914425, 120.29046535491942],
        [22.73684426881351, 120.29025077819824],
        [22.737715034437908, 120.28591632843016],
        [22.735617271475324, 120.28505802154541],
        [22.73767545430257, 120.2777624130249],
        [22.733717382905326, 120.27643203735352],
        [22.733638220308723, 120.27523040771484],
        [22.72979877936457, 120.27806282043456]
    ],
    [
        [22.731461230943435, 120.27870655059813],
        [22.732292449154702, 120.28007984161376],
        [22.733163243766654, 120.27900695800781],
        [22.73264868398435, 120.27767658233643],
        [22.731461230943435, 120.27870655059813]
    ]
], fill = True).add_to(myMap)
myMap
這邊有兩個地方要注意,在folium.vector_layers.path_options()中可以設定向量圖層的樣式,而每個向量圖層在建立的時候,也可以直接使用path_options的參數。此外,folium的填滿設定(fill)預設為false,如果在建立polygon沒有設定fill=True的話,在地圖中就會看到兩圈匡起來的線。依照上面程式碼建立的地圖樣貌如下:
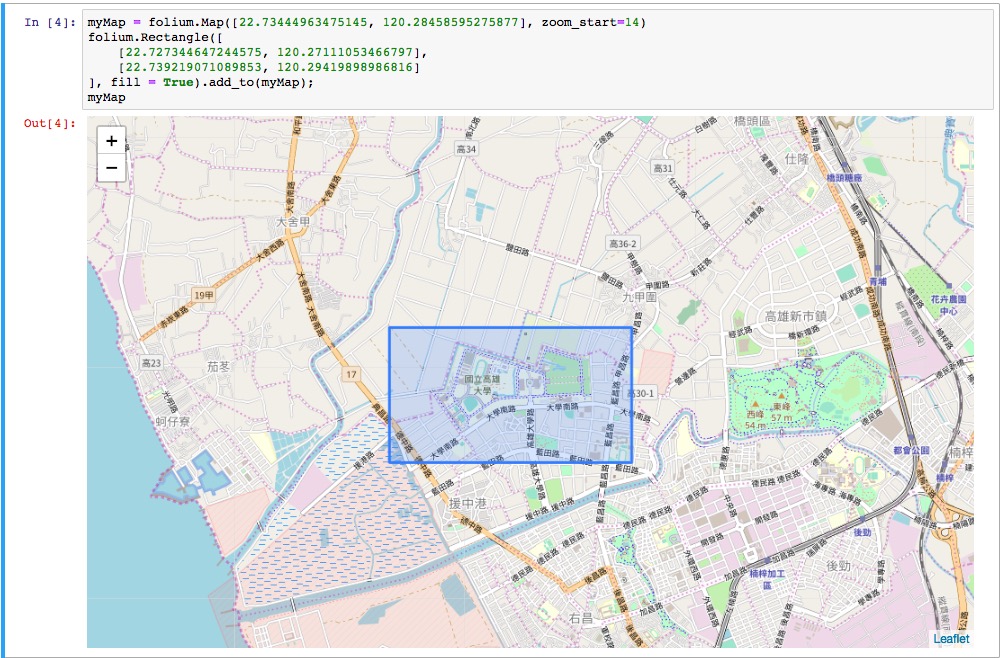
Rectangle的資料我寫在08. Leaflet_Vector Layers(下)中,使用bounds建立矩形圖層:
L.rectangle([
    [22.727344647244575, 120.27111053466797],
    [22.739219071089853, 120.29419898986816]
]).addTo(myMap);
與前面polygon設定一樣,由於folium預設的fill為false,也就是不會填滿圖層,所以相比於leaflet要多設定一個參數
folium.Rectangle([
    [22.727344647244575, 120.27111053466797],
    [22.739219071089853, 120.29419898986816]
], fill = True).add_to(myMap);
myMap
L.circle([22.73444963475145, 120.28458595275877]).addTo(myMap)
在leaflet介紹circle時有說過,官方建議在建立circle時,設定半徑的方式改到option裡面,也就是說:
//建議
L.circle(
    [22.73444963475145, 120.28458595275877],
    {
        radius: 10
    }
).addTo(myMap)
//不建議
L.circle([22.73444963475145, 120.28458595275877],10).addTo(myMap)
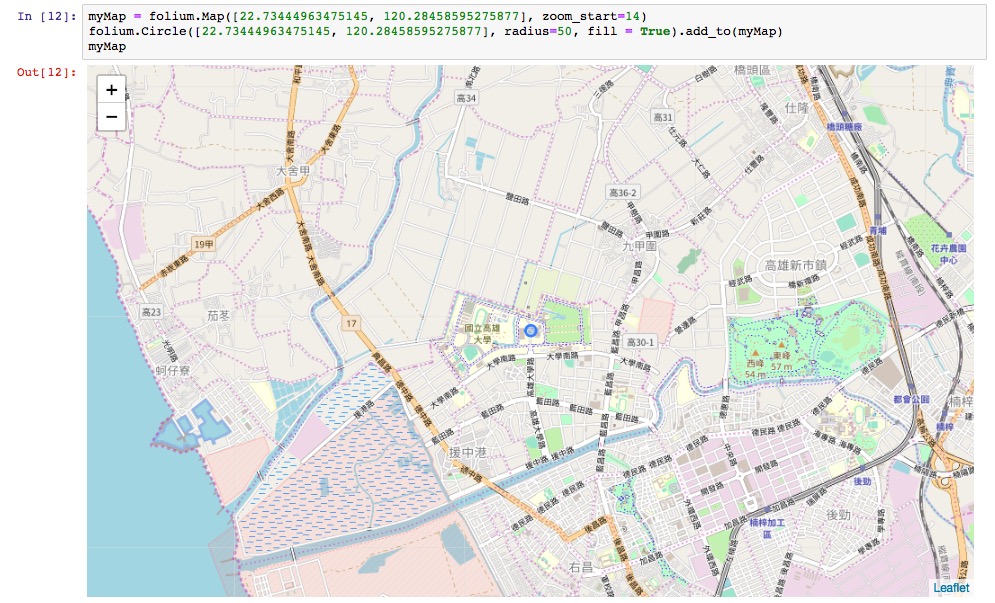
在folium中的folium.Circle()即是呼叫leaflet的 L.circle():
folium.Circle(
    [22.73444963475145, 120.28458595275877],
    radius=50,
    fill = True
).add_to(myMap)
myMap
由於circle使用的單位是公尺,也就是地圖上實際距離單位,上面程式碼設定的圓半徑為50公尺,如下圖:
L.circleMarker(
    [22.73444963475145, 120.28458595275877]
).addTo(myMap)
同樣地,CircleMarker半徑單位與lealet相同,都是pixel。這邊也同樣設定半徑為50,來比較一下:
folium.CircleMarker(
    [22.73444963475145, 120.28458595275877],
    radius=50,
    fill = True
).add_to(myMap)
myMap
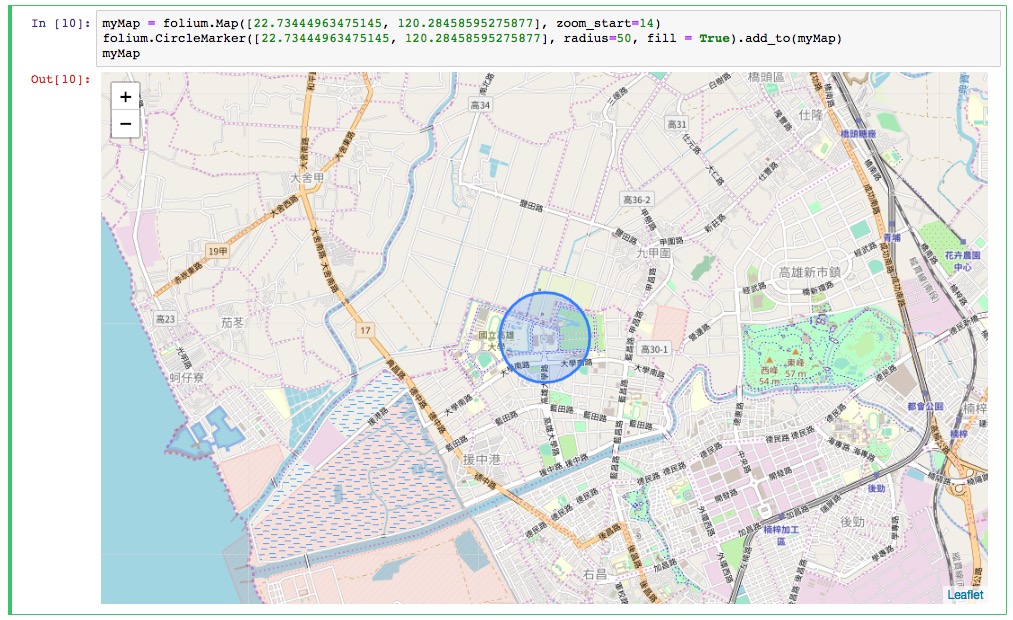
看起來是不是差很多呢!!
所以如果你要在地圖中繪製圓形的向量圖層的話,可以根據該圖層的使用目的決定他的半徑要用實際的單位(公尺)還是螢幕上的單位(pixel)。
介紹完folium的向量圖層,會發現其實跟leaflet的建立邏輯差不多,只是要注意的是folium的面圖層預設填滿的設定為False,因此如果要多設定fill參數,才能夠看到面圖層的範圍。
剩下最後9篇了!!下禮拜要來繼續介紹Raster Layers。如果有什麼問題的話,歡迎在下面留言喔~