昨天使用的Rasterio是一個方便的工具,它主要是包了一些GDAL等等的GIS套件,
使用GIS資料分析,當然一定會接觸到GDAL,GDAL Geospatial Data Abstraction Library可以說是始祖,Rasterio建構於它之上讓資料分析更加方便。
持續Rasterio的主題,今天要測試的項目是NDVI。
大綱:
NDVI是常態化植生指標參考wiki常態化差值植生指標,計算方式是利用紅光與近紅外光波段,代表植物生長與覆蓋的指數,其數值愈大表示植物生長愈多。
公式: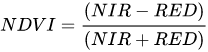
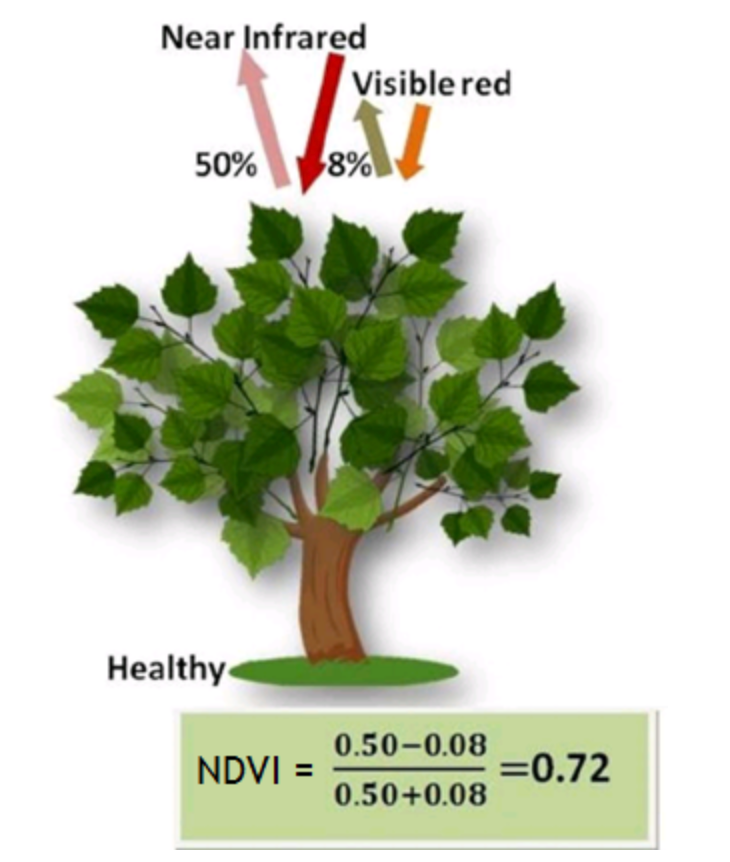
NIR為近紅外光反射;RED為紅光反射,NDVI之值介於-1到1之間。 當RED=0時,有最大值1;反之,當NIR=0時,有最小值-1。
(取自wiki常態化差值植生指標與Calculate NDVI & Extract Spectra Using Masks in Python - Flightline Data | NSF NEON | Open Data to Understand our Ecosystems)
讀取影像
import rasterio
src=rasterio.open('data/rasterio/data/test.tif')
然後,取得波段:
b1, b2, b3, b4 = src.read()
波段計算,我們使用numpy
import numpy
ndvi = numpy.zeros(b1.shape)
ndvi = (b1-b2)/(b1+b2)
展示成果
import matplotlib.pyplot as plt
from rasterio import plot
%matplotlib inline
plot.show(ndvi)
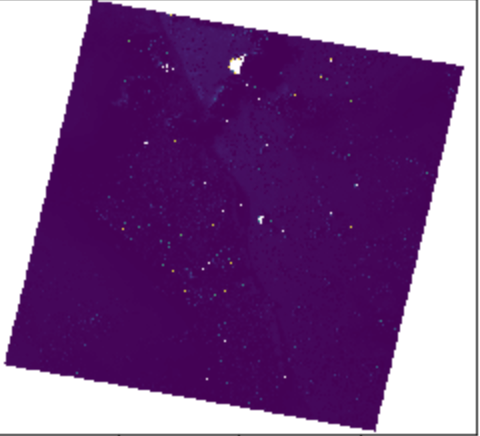
計算NDVI需要NIR為近紅外光反射的影像,如果需要影像可以使用USGS的Landsat影像: