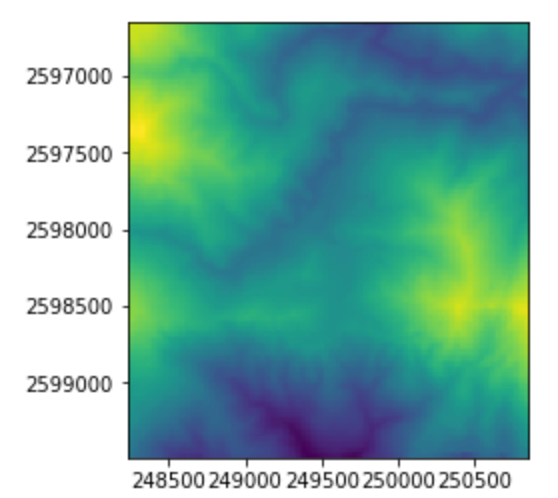
DEM(Digital Elevation Model)以二維網格的方式呈現地形,也是GIS資料常見得網格式資料,我們今天將會使用內政資料開放平臺的20米全台DEM資料,他的副檔名是grd格式(ascii),我們可以使用Rasterio讀取資料,並做一些處理。(ps.如果要使用全球的DEM,可以使用SRTM)
大綱:
grd格式可以使用GDAL中讀取,當然rasterio也可以直接讀取
import rasterio
src=rasterio.open('data/95191010dem.grd')

import matplotlib.pyplot as pltfrom
from rasterio import plot
%matplotlib inline
plot.show(src)
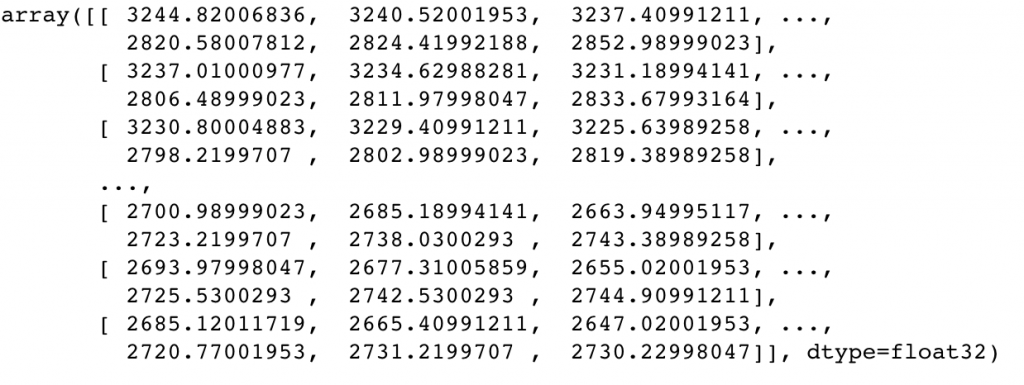
在資料處理方面,可以使用numpy以array方式處理
import numpy as np
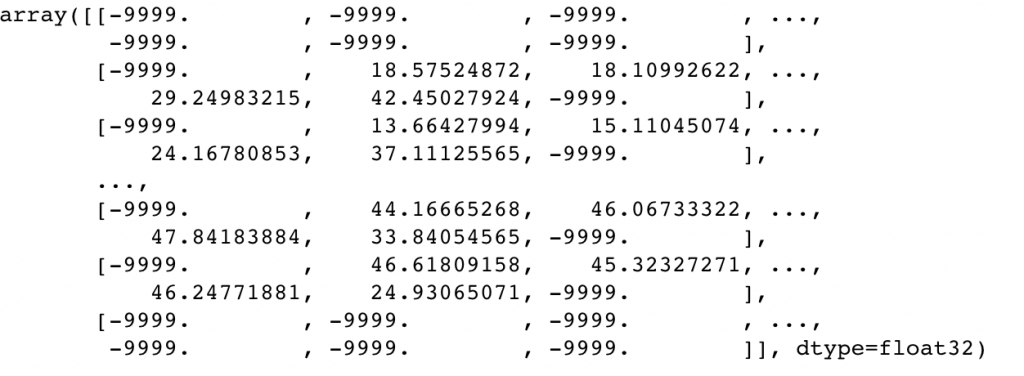
height=src.read(1) # 通常就是一個band
height
如果要轉格式,也可以把array另存成tif等格式
tif,png等等都可以是GIS網格資料的格式
(配合wordfile請參考[Day 14] WebGIS中的網格資料)
with rasterio.open('output/dem.tif', 'w', driver='GTiff', height=height.shape[0], width=height.shape[1], count=1, dtype=height.dtype) as dst:
    dst.write(height, 1)
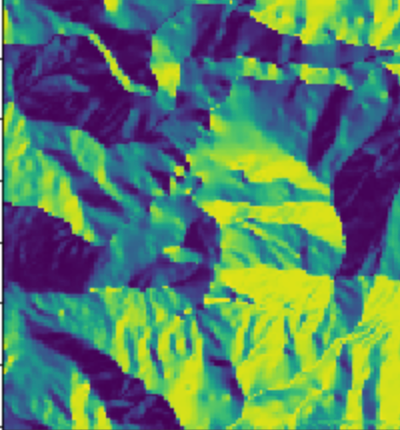
暈渲圖是地形資料常見的呈現方式,主要概念是將光源投射在地形上的時候,將光照區及陰影區一同呈現在圖上,常見於地質極大地測量等應用。
暈渲圖的計算,是假設源在某個方向和某個太陽高度下,賦予每個像元其周遭的像元的值計算而成。
def hillshade(array, azimuth, angle_altitude):

    # 取自: http://geoexamples.blogspot.com.br/2014/03/shaded-relief-images-using-gdal-python.html

    x, y = np.gradient(array)
    slope = np.pi/2. - np.arctan(np.sqrt(x*x + y*y))
    aspect = np.arctan2(-x, y)
    azimuth = azimuth*np.pi / 180.
    altitude = angle_altitude*np.pi / 180.


    shade = np.sin(altitude) * np.sin(slope)  + np.cos(altitude) * np.cos(slope)   * np.cos(azimuth - aspect)
    return 255*(shade + 1)/2
計算太陽方向及入射角皆為30的暈渲圖
plot.show(hillshade(height, 30, 30))
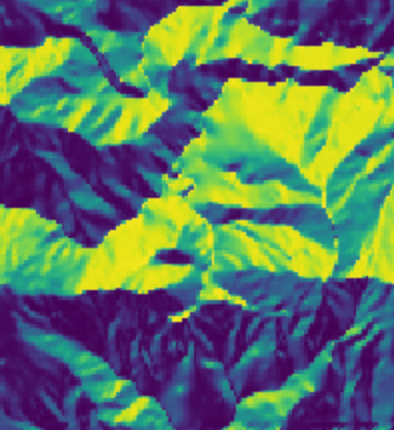
換個角度可以看到,暈渲圖的效果不同:
plot.show(hillshade(height, 280, 25))
關於暈渲圖計算可以參考以下的詳細說明<https://hk.saowen.com/a/56273e57ea6fbfc59bffd030dd8a7e5741cf1d72ec4a2436dd027012ea8ff8ec>
坡度及坡向也是DEM常用的計算
坡度坡向的計算,可以使用numpy的計算
計算方式請參考
How Slope works—Help | ArcGIS for Desktop
而下面則是直接使用GDAL的模組計算
import gdal
import numpy as np
import rasterio
# 坡度
gdal.DEMProcessing('output/slope.tif', 'data/95191010dem.grd', 'slope')
with rasterio.open('output/slope.tif') as dataset:
slope=dataset.read(1)
# 坡向
gdal.DEMProcessing('output/aspect.tif', 'data/95191010dem.grd', 'aspect')
with rasterio.open('output/aspect.tif') as dataset:
aspect=dataset.read(1)
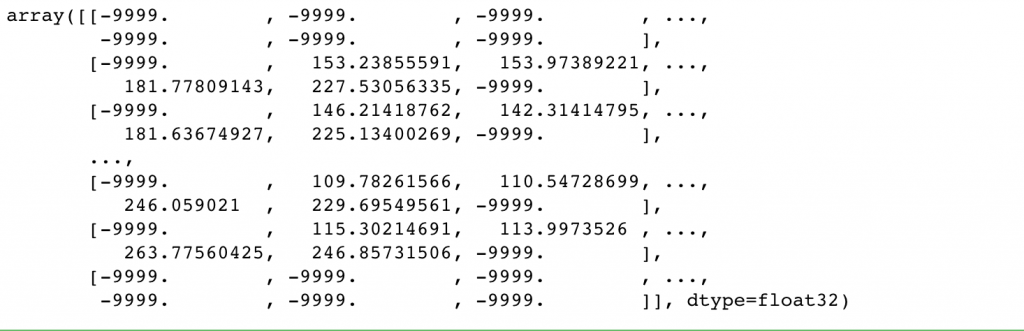
slope
aspect
http://pangea.stanford.edu/~samuelj/musings/dems-in-python-pt-1-intro.html