今天從Inside Airbnb下載的資料(calendar.csv),針對德國柏林地區的Airbnb房源繁忙程度作分析。
The data (calendar.csv) was collected from Inside Airbnb, the data was last updated on 11/07/2019.
Today's article will briefly analysise the booking rate of Airbnb listings in Berlin.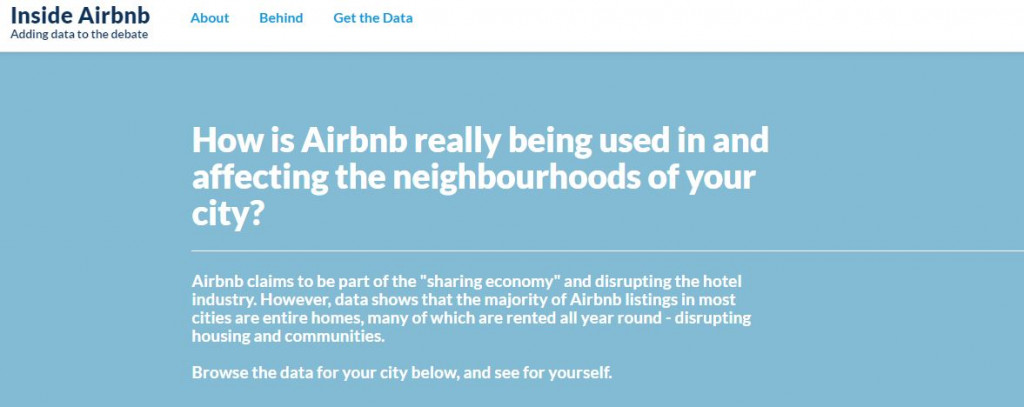
# 載入所需套件 import the packages we need
import pandas as pd
import numpy as np
import matplotlib.pyplot as plt
import plotly as py # 畫互動式圖表的開源套件 graphing library makes interactive graphs
import warnings # 忽略警告 ignore warnings
warnings.filterwarnings("ignore")
calendar = pd.read_csv('airbnb/calendar.csv') # 讀入要分析的檔案 read in the file we want to analyse
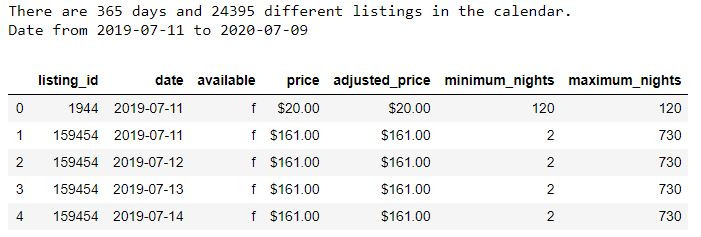
print('There are',calendar.date.nunique(), 'days and', calendar.listing_id.nunique(),'different listings in the calendar.')
print('Date from', calendar.date.min(), 'to', calendar.date.max()) # 看資料日期分布區間 chekc the time frame of our date
calendar.head() # 印出資料前五筆 print out the top 5 rows of our data
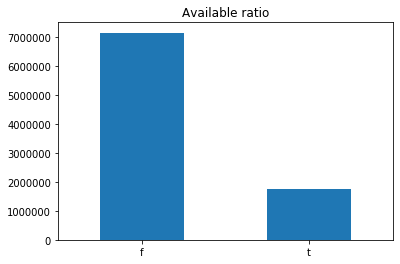
# 算資料中available欄位 f(未被預訂)與t(已被預訂)數量並畫圖,繪圖類型長條圖,並在圖上加上標題。
# count the number of f(not reserved) and t(reserved) of the column 'available'
calendar.available.value_counts().plot(kind='bar', title='Available ratio')
plt.xticks(rotation=0) # x軸旋轉角度設定為0 set the rotation angle of x ticks to zero
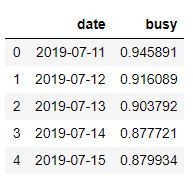
new_calendar = calendar[['date', 'available']] # 只抓出日期與是否已被預訂新建為一個dataframe create a new data frame with only 'date' and 'available' column
new_calendar['busy'] = new_calendar.available.map(lambda x:0 if x == 't' else 1) # 進行標籤編碼 label encoding
new_calendar = new_calendar.groupby('date')['busy'].mean().reset_index()
new_calendar.head() # 看一眼我們新建的dataframe have a look of our new dataframe
new_calendar['date'] = pd.to_datetime(new_calendar['date']) # 轉換時間格式 change the format of the date

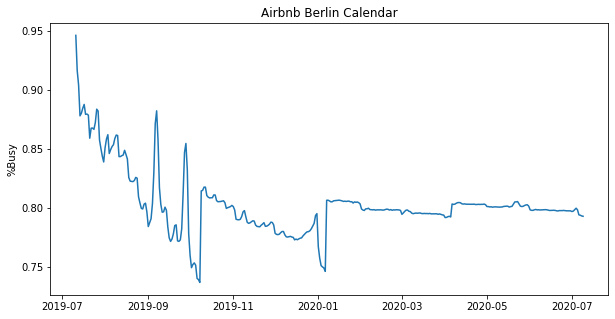
plt.figure(figsize=(10, 5))
plt.plot(new_calendar['date'], new_calendar['busy'])
plt.title('Airbnb Berlin Calendar')
plt.ylabel('%Busy')
# 處理價格資料 clean the price data
calendar['date'] = pd.to_datetime(calendar['date'])
calendar['price'] = calendar['price'].str.replace(',', '').str.replace('$', '').astype(float)

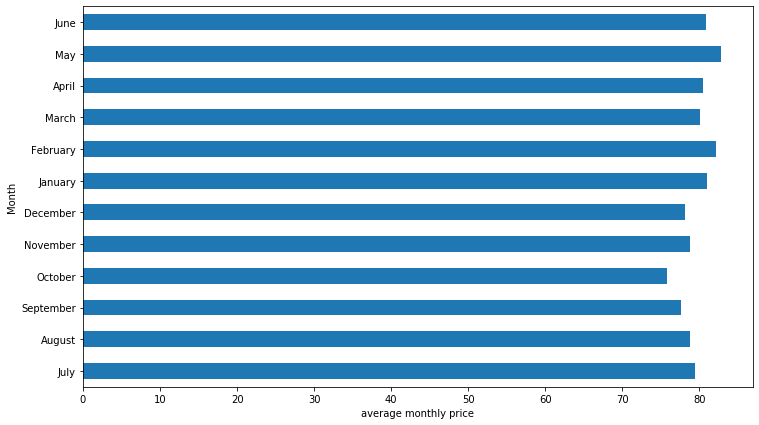
mean_of_month = calendar.groupby(calendar['date'].dt.strftime('%B'), sort=False)['price'].mean()

mean_of_month.plot(kind='barh', figsize=(12, 7))
plt.xlabel('average monthly price')
plt.ylabel('Month')
calendar['dayofweek'] = calendar.date.dt.weekday_name
cats = calendar.dayofweek.unique().tolist()
price_week = calendar.groupby('dayofweek')['price'].mean().reindex(cats)
price_week.plot(title='People seems to travel more on Fridays and Saturdays.')
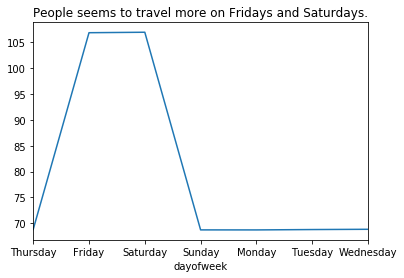
在我們分析的2019-07-11到2020-07-09區間,柏林地區Airbnb房源五月、二月價格較其他月份稍偏高,十月則最低。周五與週六訂房率較多。
From 2019-07-11 to 2020-07-09, the price of Airbnb in Berlin in February and May is slightly higher than other months yet the price in October is a little lower. There are more bookings on Fridays and Saturdays.
本篇程式碼請參考Github。The code is available on Github.
文中若有錯誤還望不吝指正,感激不盡。
Please let me know if there’s any mistake in this article. Thanks for reading.
Reference 參考資料:
[1] Inside Airbnb
[2] 利用Airbnb來更了解居住城市,以臺北為例 Python實作(上)
