昨天提到了在電腦儲存聲音時,有兩個名詞很重要——位元深度、取樣頻率,但大家看了解釋可能還不是很清楚那在幹嘛,今天我們會用python簡單的來看看一個440Hz的sin波
環境設定
需要下載以下套件:scipy(訊號處理和其他科學與工程中常用的計算)、matplotlib(繪圖)、numpy(矩陣運算)
程式
from scipy.io.wavfile import read  //read的介紹可以看本篇下面
(fs, x) = read('sine-440.wav')     //fs是用int存的取樣頻率、x是用array存的聲音訊號
                                   //使用此函式時,可以找自己有的.wav檔丟進去
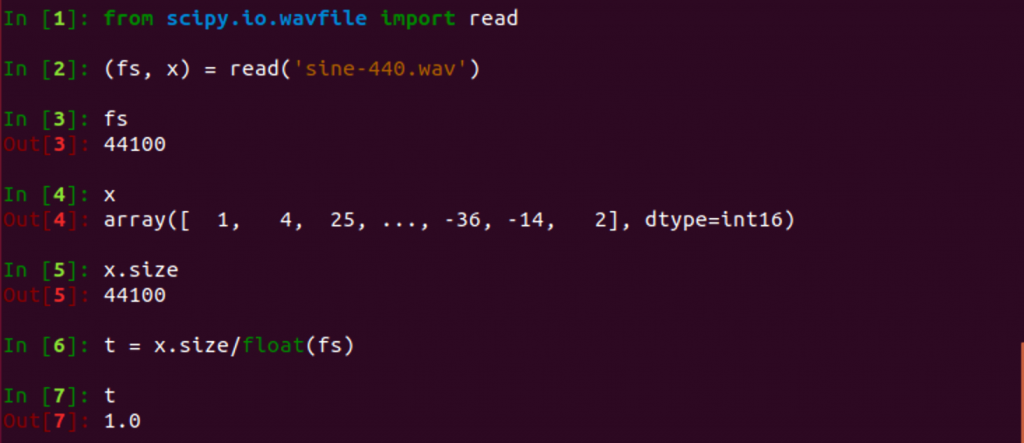
我是用ipython,所以可以在下圖很快的看到output,能看到fs、x的值和儲存形式
昨天提到的取樣頻率、時間、資料的關係(x = fs * t ),在這裡也能很清楚的看到
看完基本的參數後,我們來看看要怎麼把圖畫出來吧~
但首先先把時間(t)變成矩陣,再描圖
import numpy as np
t = np.arange(x.size)/float(fs)

import matplotlib.pyplot as plt
plt.plot(t, x)    //描繪圖形
plt.show()        //顯示圖形
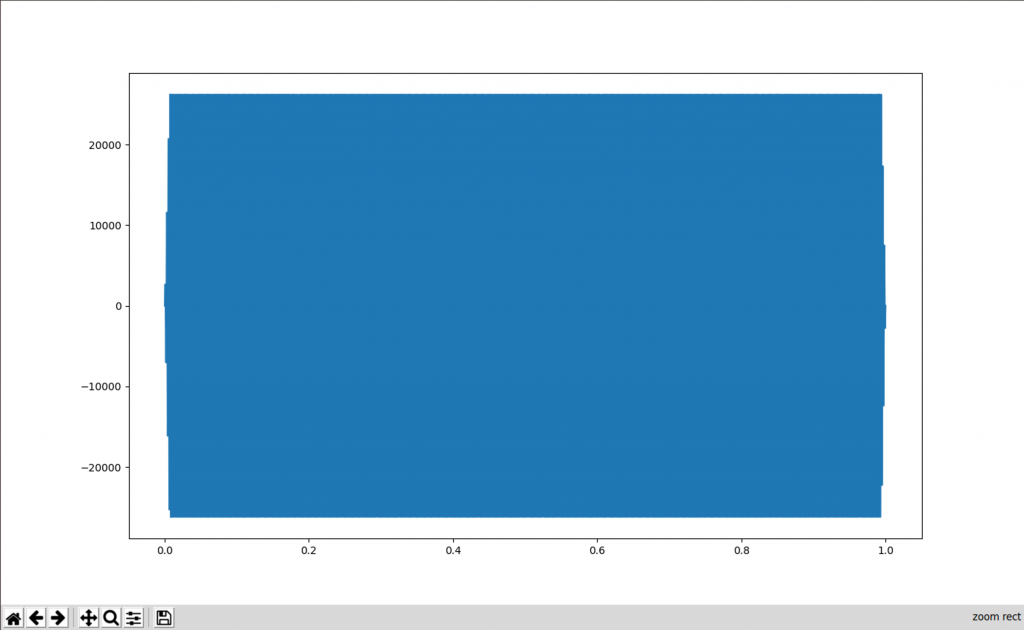
下圖看起來好像一坨東西
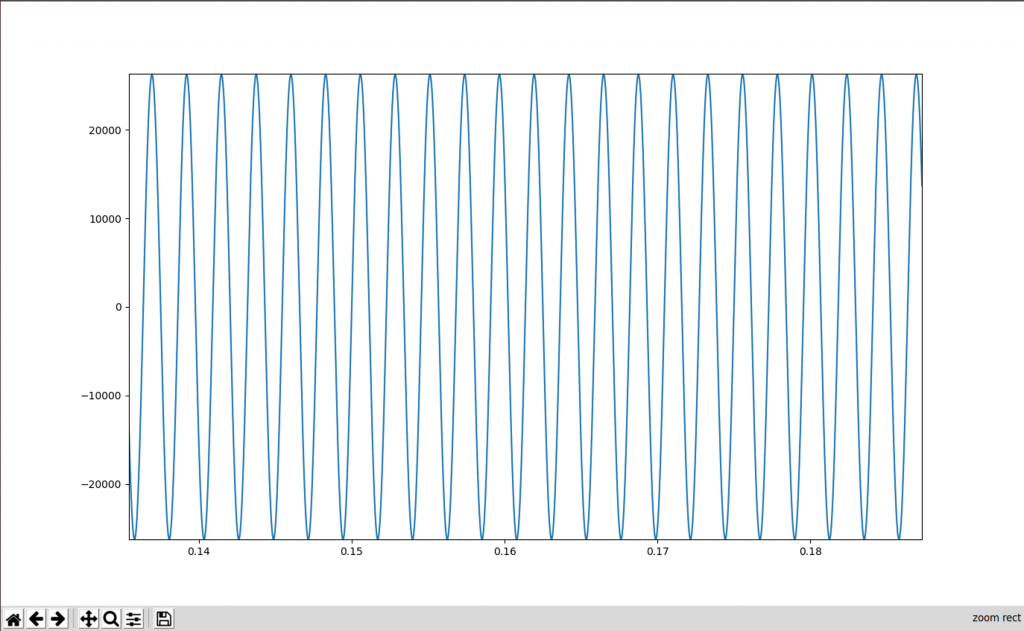
放大之後就能看出波的形狀了吧~
以下為read的介紹
在ipython打help(read)時,可以看到read的介紹
read(filename, mmap=False)
    Open a WAV file

    Return the sample rate (in samples/sec) and data from a WAV file.

    Parameters
    ----------
    filename : string or open file handle
        Input wav file.
    mmap : bool, optional
        Whether to read data as memory-mapped.
        Only to be used on real files (Default: False).

        .. versionadded:: 0.12.0

    Returns
    -------
    rate : int
        Sample rate of wav file.
    data : numpy array
        Data read from wav file.  Data-type is determined from the file;
