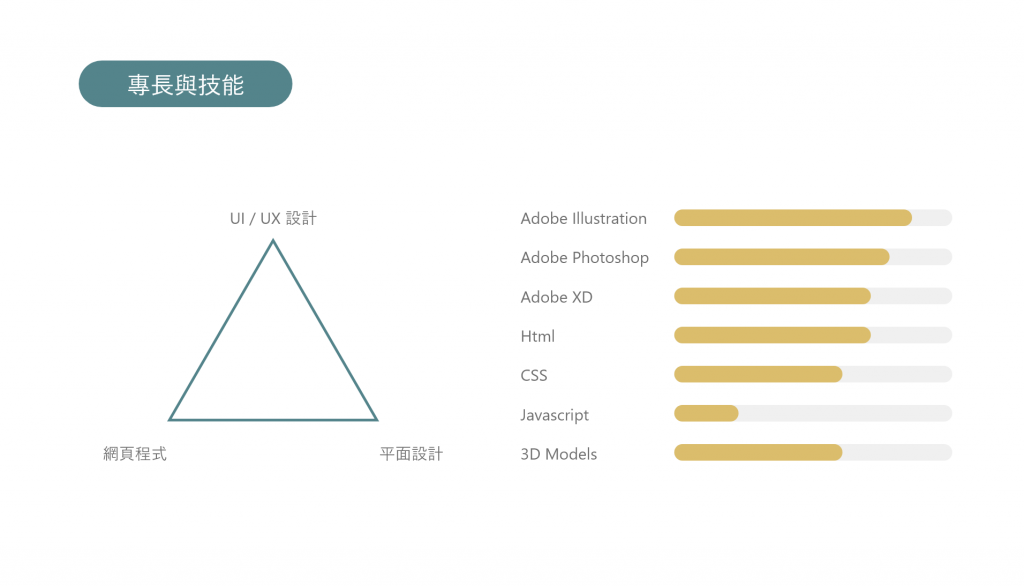
雖然先前使用html 的 <progress id= "file" value="32" max="100"> 32% </progress> 成功製作出量表,雖然有現成的量表,但後來發現好像無法對他做CSS 調整,所以最後決定使用div 製作。
<div class="progressbar">
		<p>Adobe Illustrator</p>
    <div class="bar-bg">
        <div class="bar-color" style="width: 90%"></div>
    </div>
</div>
用一個div包住另一個div,外面的是量表的底,裡面是量表數值的部分。
.bar-bg{
    height: 15px;
    width: 200px;
    background-color: #e9e9e9;
    border-radius: 20px;
    overflow: hidden;
}
.bar-bg .bar-color{
    height: 100%;
    background-color: #E0BD5E;
}
製作出量表的公版之後,長度直接在style="width: 90%“進行調整。文字則是另外一個包住p標籤的div。
再將這些量表做對齊就好囉!
.progressbar{
    display: flex;
    flex-flow: row wrap;
    align-items: center;
    justify-content: space-between;
    width: 30vw;
}
.skill{
    display: flex;
    align-items: center;
    justify-content: space-around;
}
下一章 Keep Going 7 - 時間軸
※本文章所使用之圖片皆為本人作品,內容則為本人之經驗分享
